



Welcome to TradeScalpPRO Academy
If you are a complete beginner, you are in the right place. In these lessons, you will learn the basic concepts that every trader should know before they start trading.
What Are Cryptocurrencies?
Cryptocurrencies are digital (online) money that operate using a technology called blockchain.
They are not controlled by a single bank or government but work in a decentralized way through a network of computers around the world.
The most well-known cryptocurrency is Bitcoin, but there are thousands of others, such as Ethereum, Solana, and XRP.


How Do Cryptocurrencies Work?
Every transaction is recorded on a blockchain — a public digital database that cannot be easily modified or deleted. This makes cryptocurrencies transparent and secure.
People use cryptocurrencies for:
Investing
Trading
Money transfers
Payments
Modern technologies and applications


What Is Trading?
Trading is the process of buying and selling financial assets, such as cryptocurrencies, stocks, commodities, or currencies, with the goal of making a profit from price movements.
Traders analyze the market, look for opportunities, and decide when to enter or exit a trade.
There are different types of trading, including:
Scalping (very short-term trades)
Day Trading (opening and closing trades within the same day)
Swing Trading (holding trades for several days or weeks)
Long-Term Investing
For beginners, it is important to first learn the basics of market analysis, risk management, and trading psychology before risking real money.
What Influences Cryptocurrency Prices?
Cryptocurrency prices constantly change based on:
Supply and demand
News and media coverage
Market sentiment
Economic conditions
Large investors (whales)
Technical analysis
This is why cryptocurrencies are highly volatile — their prices can rise or fall very quickly.
What Is Technical Analysis?
Technical analysis is a method in which traders analyze charts, indicators, and price movements to predict the future direction of the market.
Common tools include:
Support and resistance levels
EMA indicators
Volume
Momentum
Trend lines
Price action
Modern AI trading assistants such as TradeScalpPRO are built on these principles.
Important Notice
Trading is not a guaranteed way to make money. Financial markets are risky, and every trader can experience losses.
That is why the following are important:
Education
Risk Management
Discipline
A Proper Trading Strategy
TradeScalpPRO Academy
TradeScalpPRO Academy is the educational part of the TradeScalpPRO project, focused on:
Cryptocurrencies
Trading
Technical Analysis
AI Trading Technologies
Risk Management
The Future of Modern Trading
The goal of the academy is to help beginners understand financial markets and build a solid foundation before they start trading with real money.



How to Read Candlestick Charts
What Is a Candlestick Chart?
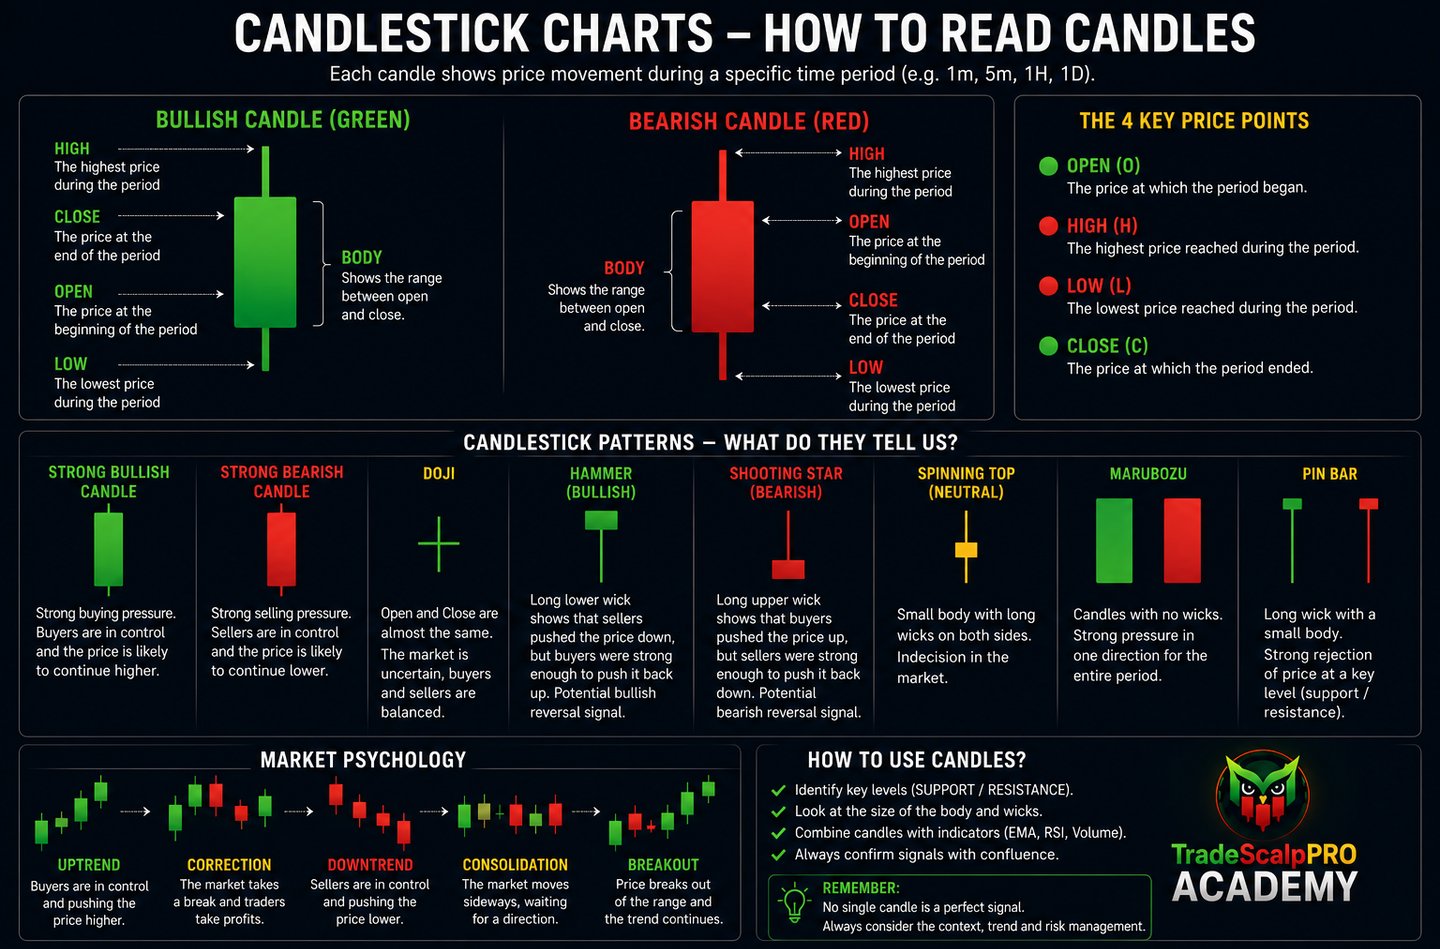
A candlestick chart is the most commonly used chart type in trading. Each candlestick shows how the price moved during a specific period of time.
Examples:
- 1-minute chart = one candlestick represents 1 minute
- 5-minute chart = one candlestick represents 5 minutes
- 1-hour chart = one candlestick represents 1 hour
What Does a Candlestick Consist Of?
Each candlestick contains 4 important values:
Open
The price at the beginning of the period.
High
The highest price reached during the period.
Low
The lowest price reached during the period.
Close
The price at the end of the period.
💡 Tip for beginners:
The relationship between the Open and Close prices determines whether the candle is bullish (price increased) or bearish (price decreased).
Green Candle 🟢
A green candle means that the price increased during the selected period.
Close is higher than Open.
Example:
Open: 100 USDC
Close: 105 USDC
Buyers were in control.
Red Candle 🔴
A red candle means that the price decreased during the selected period.
Close is lower than Open.
Example:
Open: 105 USDC
Close: 100 USDC
Sellers were in control.
Candle Body
The body is the main part of a candlestick.
Large Body
Strong buying pressure
Strong selling pressure
Small Body
Market indecision
A battle between buyers and sellers
Candle Wicks
Wicks show how far the price moved during the selected period.
Upper Wick
The price moved higher but was pushed back down by sellers.
Lower Wick
The price moved lower but was pushed back up by buyers.
Long wicks often signal price rejection.
Large Green Candle
🟢 Buyers are in control.
Often confirms an uptrend.
Large Red Candle
🔴 Sellers are in control.
Often confirms a downtrend.
Doji
The Open and Close prices are almost the same.
It signals market indecision.
Neither buyers nor sellers have gained control.
Hammer
A small body at the top of the candle.
A long lower wick.
Often signals a potential bullish reversal (price may move higher).
Shooting Star
A small body at the bottom of the candle.
A long upper wick.
Often signals a potential bearish reversal (price may move lower).
How Does TradeScalpPRO Use Candlesticks?
TradeScalpPRO analyzes:
✅ Candle strength
✅ Body size
✅ Wick size
✅ Market momentum
✅ EMA trend
✅ Volume
Thanks to this analysis, it can identify:
🟢 LONG
🔴 SHORT
🟡 WAIT (no clear trading opportunity)
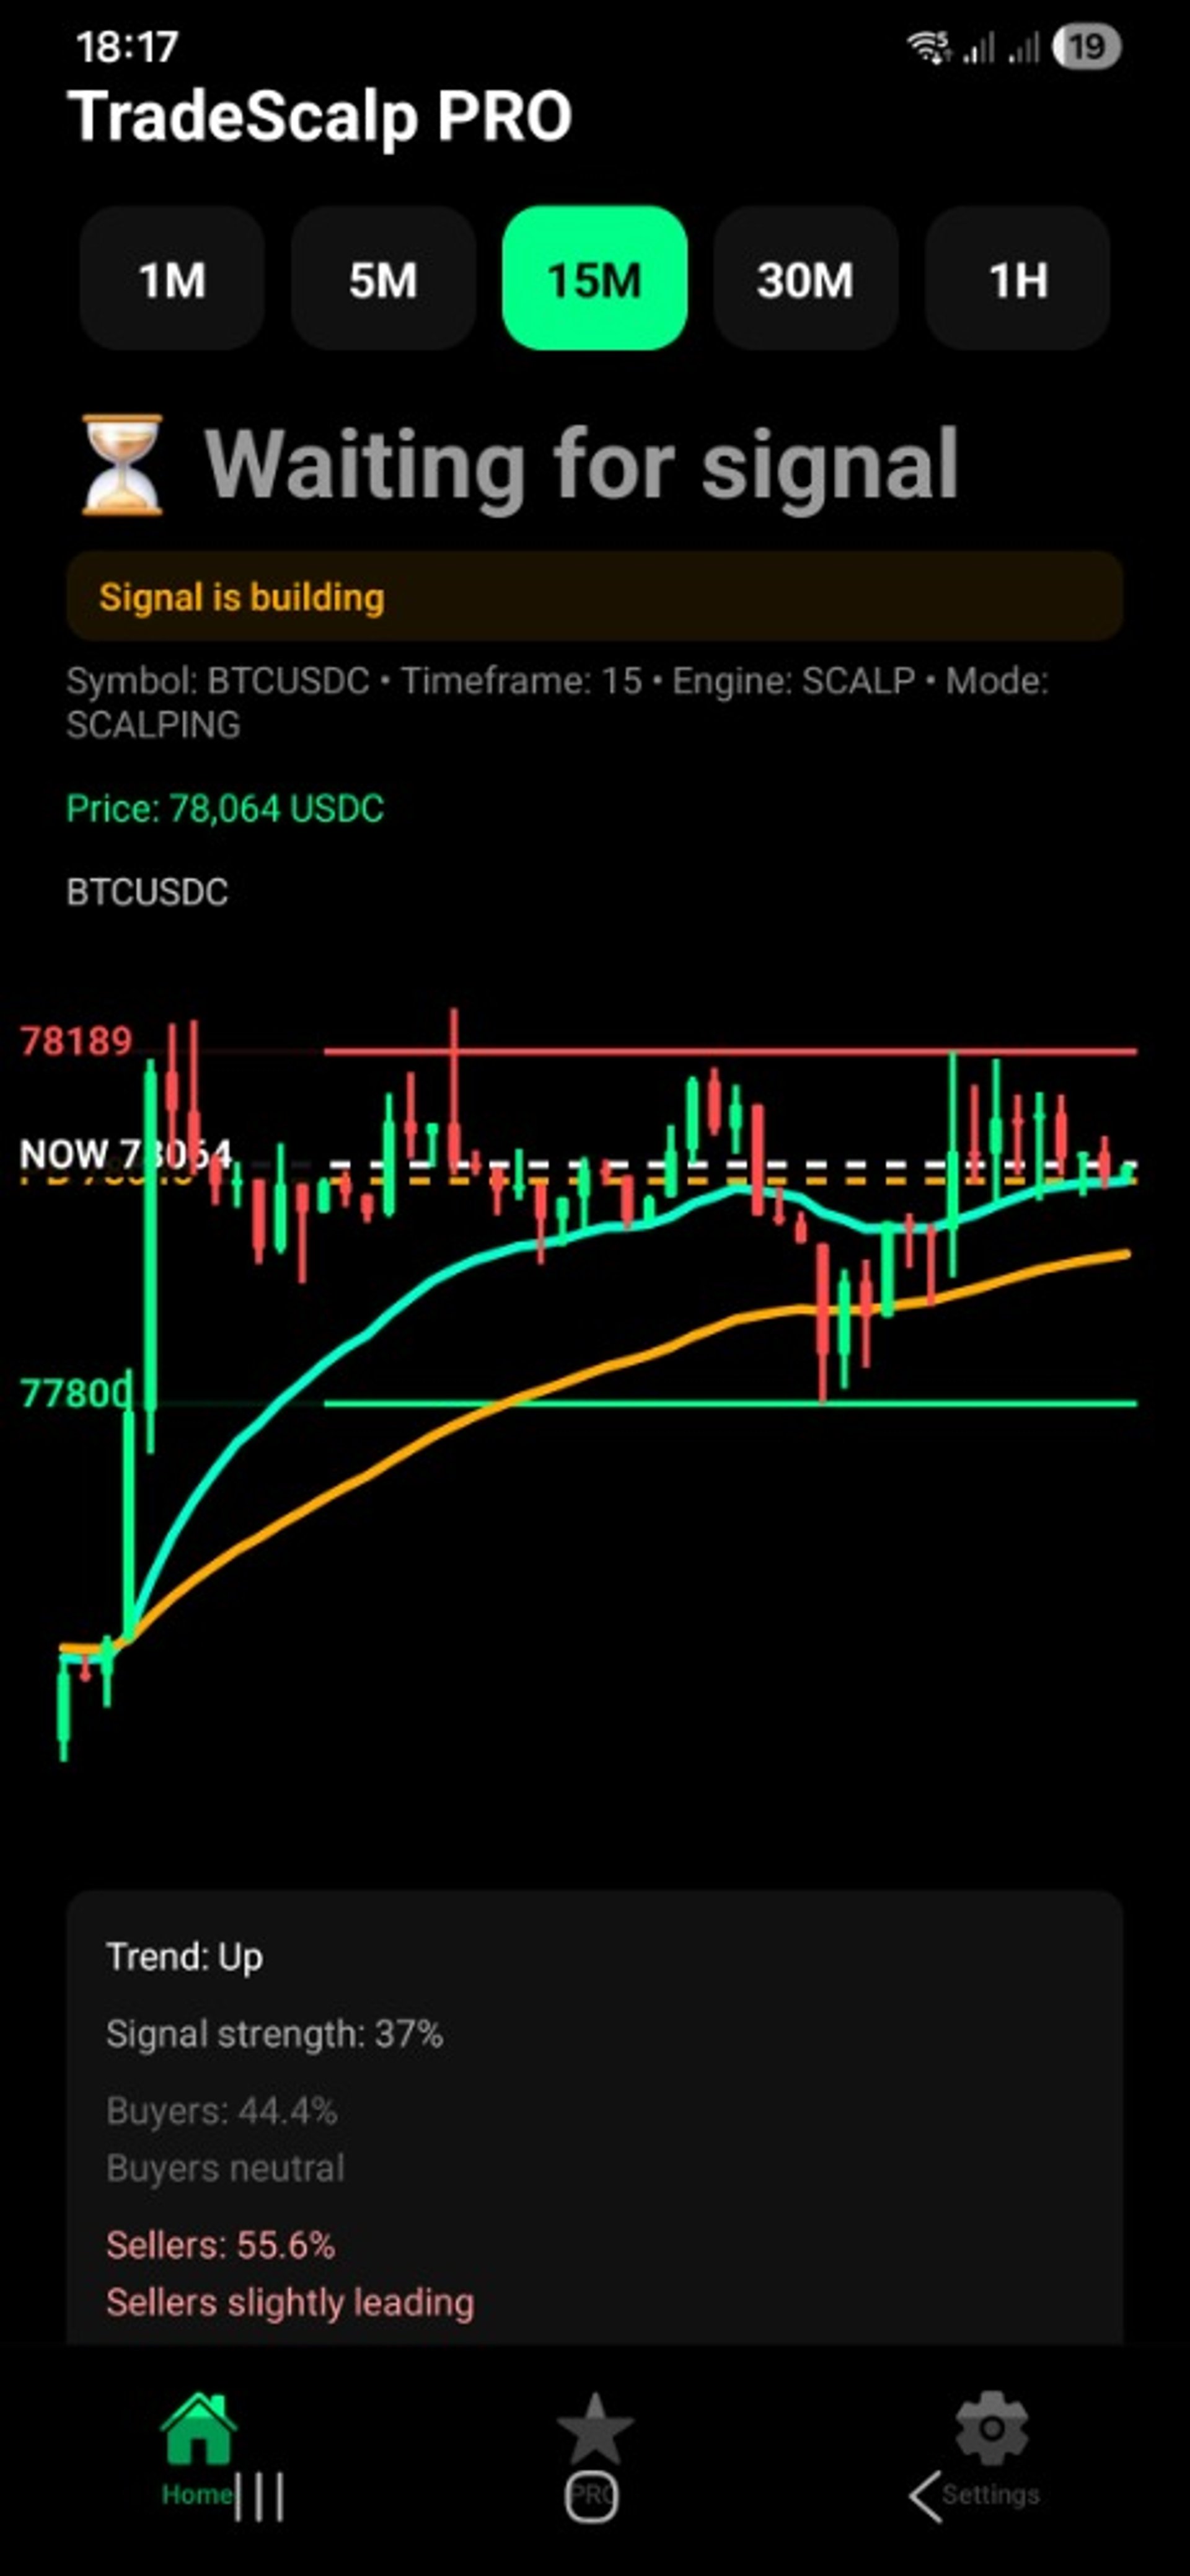
Practical Exercise
Open a Bitcoin chart.
Find:
The largest green candle from the last 24 hours.
The largest red candle from the last 24 hours.
A candle with a long lower wick.
A candle with a long upper wick.
A place where several green candles formed in a row.
Try to Answer:
Who was in control?
Buyers or sellers?
Support and Resistance: The Complete Guide
Introduction
Support and Resistance are among the most important concepts in technical analysis. Almost every professional trader uses them to find entries, exits, and manage risk.
If you learn how to correctly identify these levels, you will gain a significant advantage over most beginner traders.
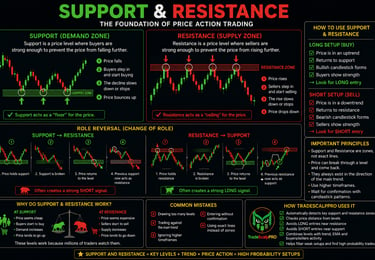
What Is Support?
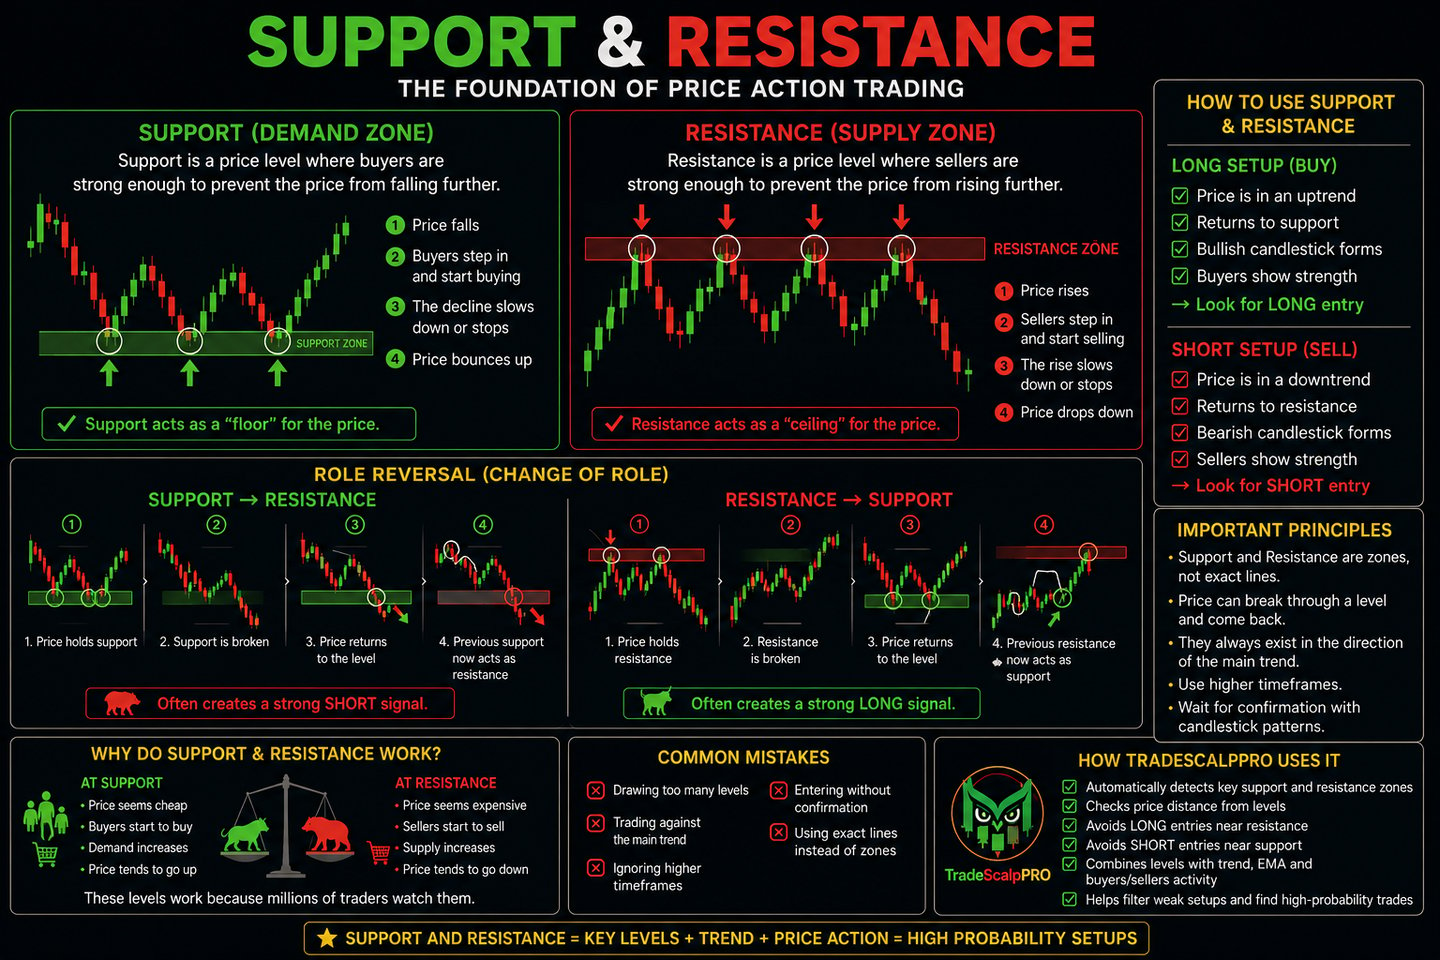
Support is a price level where buyers tend to enter the market.
When the price falls and reaches a support level, buying pressure often increases.
Simply Put:
- Price is falling.
- Buyers start buying.
- The decline slows down or stops.
- Price may bounce higher.
📈 Support acts as the market's “floor”.
What Is Resistance?
Resistance is a price level where sellers tend to enter the market.
When the price rises and reaches a resistance level, selling pressure often increases.
Simply Put:
- Price is rising.
- Sellers start selling.
- The rally slows down or stops.
- Price may reverse lower.
📉 Resistance acts as the market's “ceiling”.
How to Identify Support and Resistance
Support
Look for areas where price has bounced upward multiple times.
Example:
- Price falls to $100.
- It bounces higher.
- Later, it returns to $100 again.
- It bounces once more.
➡️ The area around $100 is a support level.
---
Resistance
Look for areas where price has reversed downward multiple times.
Example:
- Price rises to $120.
- It turns lower.
- Later, it returns to $120.
- It falls again.
➡️ The area around $120 is a resistance level.
Support and Resistance Are Not Exact Lines
One of the biggest mistakes beginners make is drawing a single thin line.
In reality, support and resistance are usually:
✅ Support Zones
or
✅ Resistance Zones
Price can briefly break through these areas and then return.
That is why traders work with zones rather than a single price level.
Role Reversal
One of the most powerful concepts in trading.
Support Becomes Resistance
1. Price holds support.
2. Support is broken.
3. Price returns to the level.
4. The former support now acts as resistance.
📉 This often creates a strong SHORT opportunity.
---
Resistance Becomes Support
1. Price holds resistance.
2. Resistance is broken.
3. Price returns to the level.
4. The former resistance now acts as support.
📈 This often creates a strong LONG opportunity.
Using Support and Resistance for Entries
LONG Entry
Ideal conditions:
✅ Price is in an uptrend
✅ Price returns to support
✅ A bullish candlestick appears
✅ Buyers are gaining strength
Then a LONG entry may be considered.
---
SHORT Entry
Ideal conditions:
✅ Price is in a downtrend
✅ Price returns to resistance
✅ A bearish candlestick appears
✅ Sellers are gaining strength
Then a SHORT entry may be considered.
Market Psychology
Support and Resistance work because millions of traders watch the same levels.
At Support
- The price appears cheap.
- Traders start buying.
- Demand increases.
At Resistance
- The price appears expensive.
- Traders start selling.
- Supply increases.
This is why these levels continue to work decade after decade.
---
Common Mistakes
❌ Drawing too many levels.
❌ Trading against the main trend.
❌ Ignoring higher timeframes.
❌ Entering without candlestick confirmation.
❌ Using a single line instead of a zone.
Resistance
Support
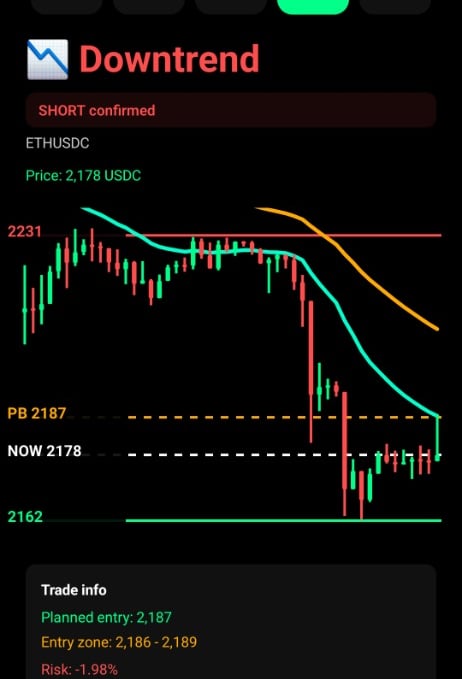
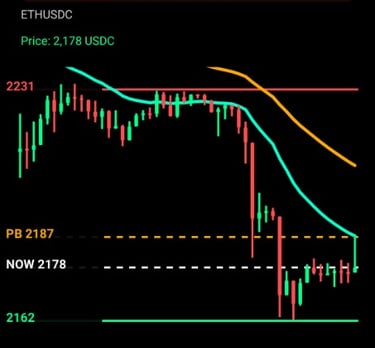
How TradeScalpPRO Uses Support and Resistance
TradeScalpPRO automatically:
✅ Detects key support and resistance levels.
✅ Measures the distance between price and important levels.
✅ Avoids LONG entries directly below resistance.
✅ Avoids SHORT entries directly above support.
✅ Combines levels with trend analysis, EMA indicators, and buyer/seller activity.
This helps filter out weak trades and identify higher-probability opportunities.
Summary
📌 Support = an area where buyers dominate.
📌 Resistance = an area where sellers dominate.
📌 These are zones, not exact lines.
📌 Broken support can become resistance.
📌 Broken resistance can become support.
📌 The best trades occur when trend direction aligns with key levels.
Homework
Open a BTCUSDC or ETHUSDC chart and identify:
1. Three support levels.
2. Three resistance levels.
3. One example of a Role Reversal.
If you can correctly identify these levels, you have mastered one of the most important foundations of professional trading. 🚀📈

How to Identify Market Trends
What is a trend?
A trend is the direction in which the market is moving over time.
Before entering any trade, you should always know what type of trend the market is in. Trading against the trend is one of the most common mistakes beginners make.
Basic Rule
First identify the trend. Then look for an entry.
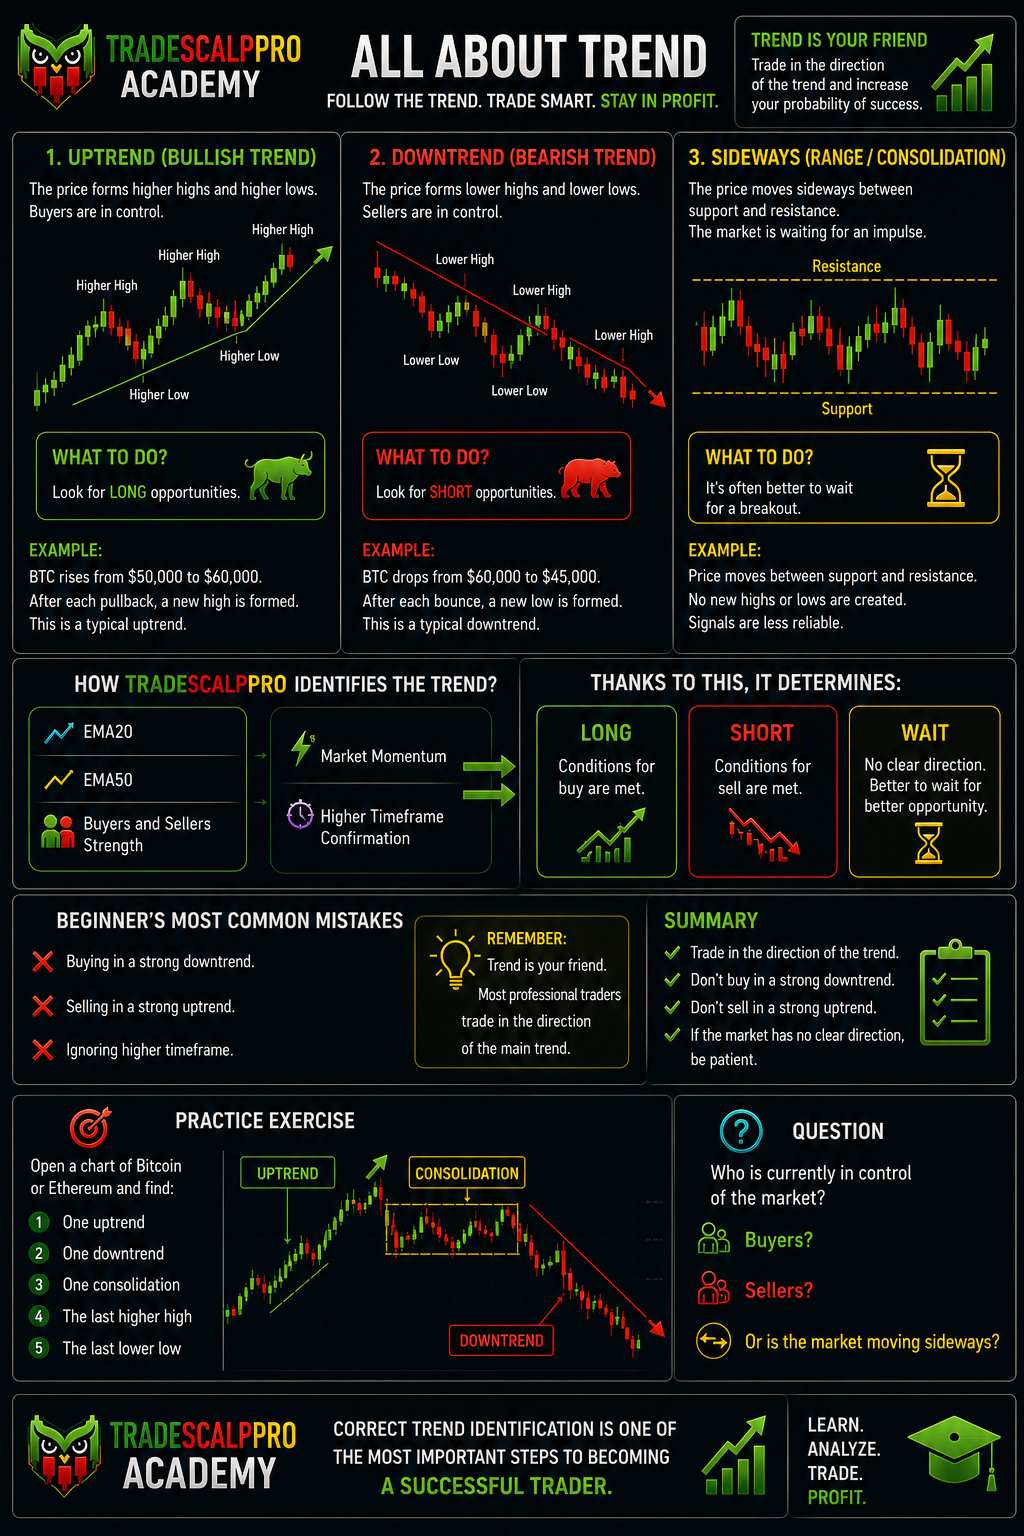
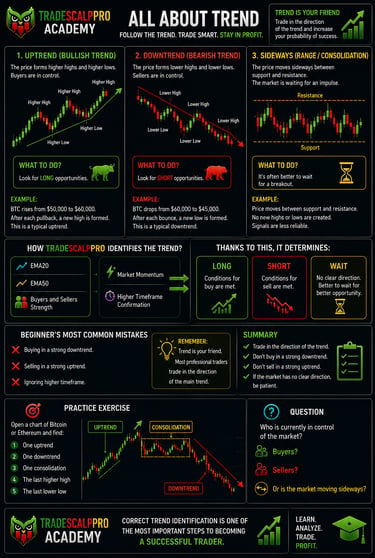
1. Uptrend (Bullish Trend) 📈
An uptrend means the price is moving higher over time.
How to identify it?
✅ The price forms Higher Highs
✅ The price forms Higher Lows
✅ Buyers are in control of the market
What should you do?
🟢 Look primarily for LONG opportunities.
Example
Bitcoin rises from $50,000 to $60,000.
After each pullback, a new high is created.
This is a typical uptrend.
2. Downtrend (Bearish Trend) 📉
A downtrend means the price is moving lower over time.
How to identify it?
✅ The price forms Lower Highs
✅ The price forms Lower Lows
✅ Sellers are in control of the market
What should you do?
🔴 Look primarily for SHORT opportunities.
Example
Bitcoin falls from $60,000 to $45,000.
After each bounce, a new low is created.
This is a typical downtrend.
3. Sideways Market (Consolidation) ↔️
A sideways market has no clear direction.
The price moves between support and resistance.
How to identify it?
✅ Price moves sideways
✅ No new highs or lows are created
✅ The market is waiting for momentum
What should you do?
🟡 It is often better to wait for a breakout.
Signals are generally less reliable during consolidation.
The First Candles of a Trend
The first candles of a trend are important because they may signal the beginning of a new move.
First Bullish Candles
An uptrend may be starting when:
- A strong green candle appears after a decline
- Price breaks above a recent local high
- A green candle closes above EMA20
- Volume starts increasing
- The next candle confirms the move
One green candle alone is not enough.
A trader waits for confirmation.
First Bearish Candles
A downtrend may be starting when:
- A strong red candle appears after a rise
- Price breaks below a recent local low
- A red candle closes below EMA20
- Volume starts increasing
- The next candle confirms the move
The Last Candles of a Trend
The final candles often indicate that a trend is losing strength.
Signs of an Uptrend Ending
- Long upper wicks
- Smaller green bodies
- Red candles near the top
- Price fails to make a new high
- Break below the last higher low
- Loss of EMA20 or EMA50 support
This suggests buyers are losing control.
Signs of a Downtrend Ending
- Long lower wicks
- Smaller red bodies
- Green candles near the bottom
- Price fails to make a new low
- Break above the last lower high
- Return above EMA20 or EMA50
This suggests sellers are losing control.
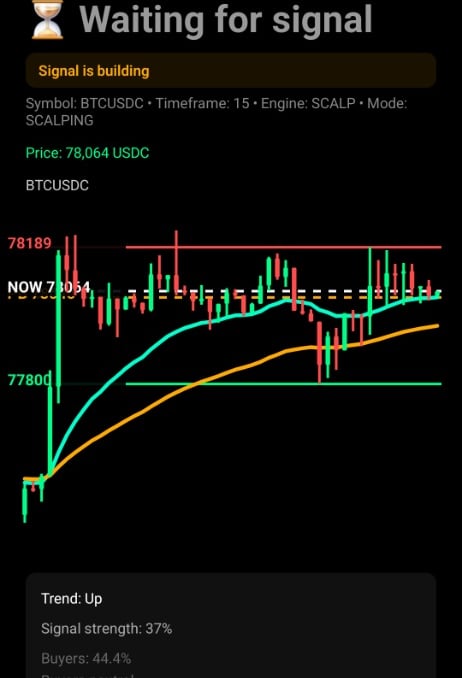
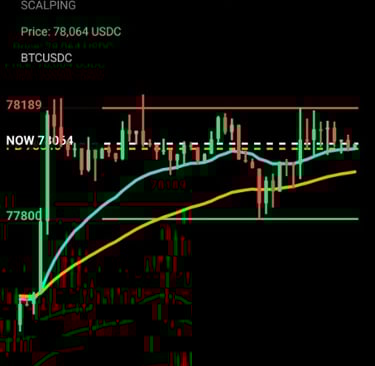
How Does a Trader Identify a Strong Trend?
A strong trend usually shows several signals at the same time.
Strong Uptrend
✅ Price is above EMA20 and EMA50
✅ EMA20 is above EMA50
✅ Candles close near their highs
✅ Pullbacks are small
✅ Volume increases during rallies
✅ Support levels hold
✅ The market forms higher highs and higher lows
Strong Downtrend
✅ Price is below EMA20 and EMA50
✅ EMA20 is below EMA50
✅ Candles close near their lows
✅ Upward bounces are weak
✅ Volume increases during sell-offs
✅ Resistance levels hold
✅ The market forms lower highs and lower lows
How Does a Trader Identify a Weak Trend?
A weak trend lacks momentum.
Signs of a Weak Uptrend
Small green candles
Long upper wicks
Slow price growth
Low volume
Frequent moves below EMA20
Price struggles to stay above resistance
Signs of a Weak Downtrend
Small red candles
Long lower wicks
Slow price decline
Low volume
Frequent moves above EMA20
Price struggles to stay below support
Trend and Timeframes
A trend may look different on different timeframes.
For example:
- The 1-minute chart may show a short-term decline
- The 15-minute chart may still be bullish
- The 1-hour chart may show the main trend is bullish
- That is why traders never rely on only one timeframe.
Simple Rule
Higher timeframes show the main trend.
Lower timeframes help find entries.
Example
- 1H = Uptrend
- 15M = Uptrend
- 5M = Pullback
- 1M = First bullish confirmation
This can be a good LONG opportunity.
EMA and Trend Identification
EMAs help traders quickly identify market direction.
EMA20
Shows the short-term trend.
EMA50
Shows the medium-term trend.
EMA200
Shows the major long-term trend.
Bullish Structure
✅ Price is above EMA20, EMA50, and EMA200
✅ EMA20 is above EMA50
✅ EMA50 is above EMA200
This indicates a strong bullish trend.
Bearish Structure
✅ Price is below EMA20, EMA50, and EMA200
✅ EMA20 is below EMA50
✅ EMA50 is below EMA200
This indicates a strong bearish trend.
False Breakout
A false breakout occurs when price breaks support or resistance but quickly returns back.
How to identify it?
Long wick beyond the level
Candle closes back inside the range
The next candle fails to confirm the breakout
Volume is weak
This is why traders wait for candle closes, not just price touches.
Trend Confirmation
A trend becomes stronger when multiple factors align:
✅ EMA direction
✅ Market structure
✅ Candle strength
✅ Volume
✅ Support and resistance
✅ Higher timeframe confirmation
✅ Momentum
The more confirmations you have, the higher the quality of the setup.
Practical Rule for Beginners
Before entering any trade, ask yourself:
1. Is the market in an uptrend, downtrend, or consolidation?
2. Is the price forming higher highs/lows or lower highs/lows?
3. Is the price above or below EMA20 and EMA50?
4. Are the latest candles strong or weak?
5. Does the higher timeframe confirm the direction?
If the answers are unclear, the best signal is:
🟡 WAIT
Summary
A trader identifies trends through market structure, recent candles, EMAs, volume, and higher timeframe confirmation.
🟢 In an uptrend, look mainly for LONG opportunities.
🔴 In a downtrend, look mainly for SHORT opportunities or stay patient.
🟡 During consolidation, waiting is often the best choice.
Remember:
Successful traders read the market first. Then they trade. 📈🚀
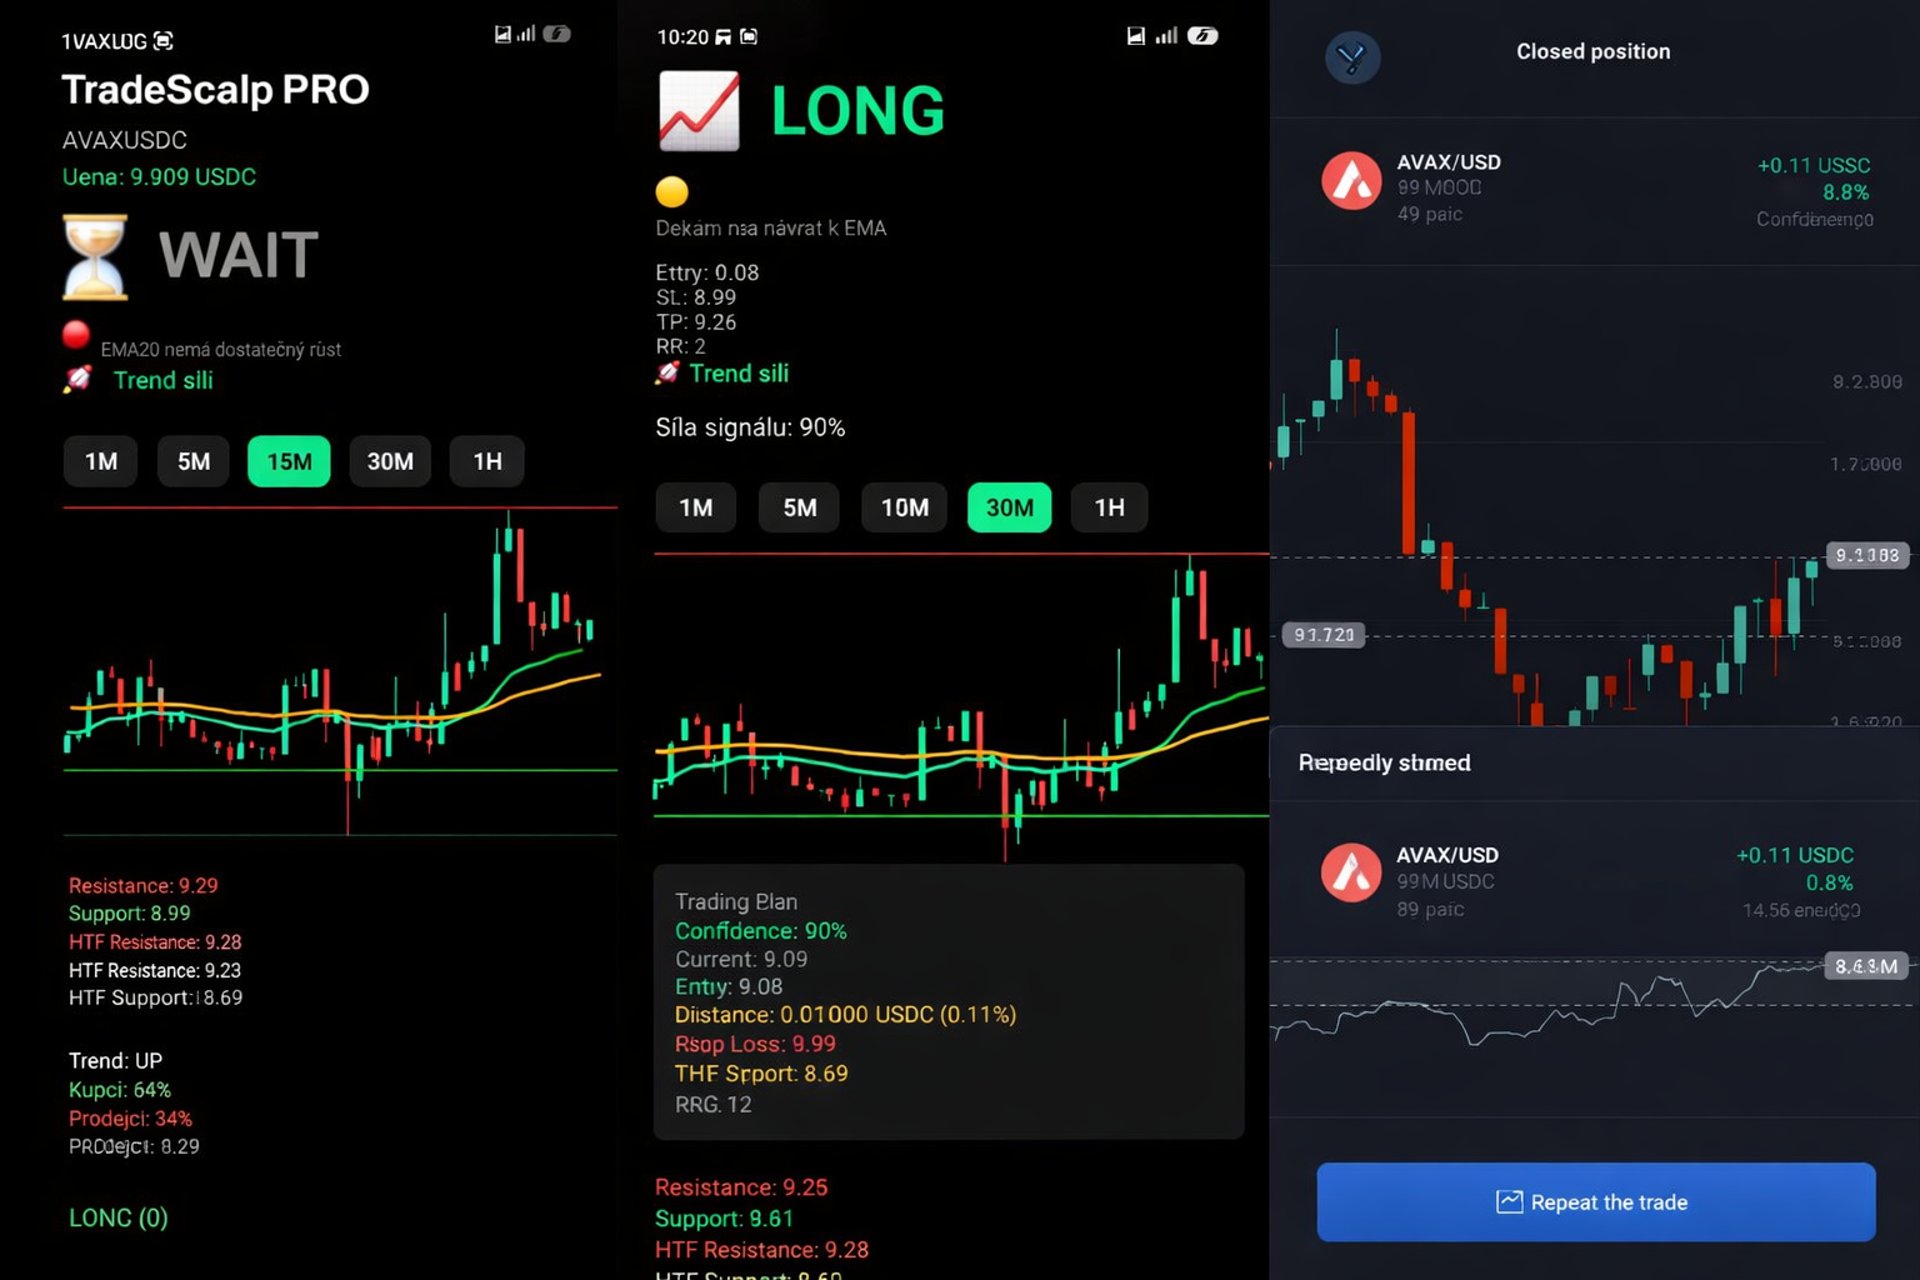
Price Action
How to Read the Market Without Indicators
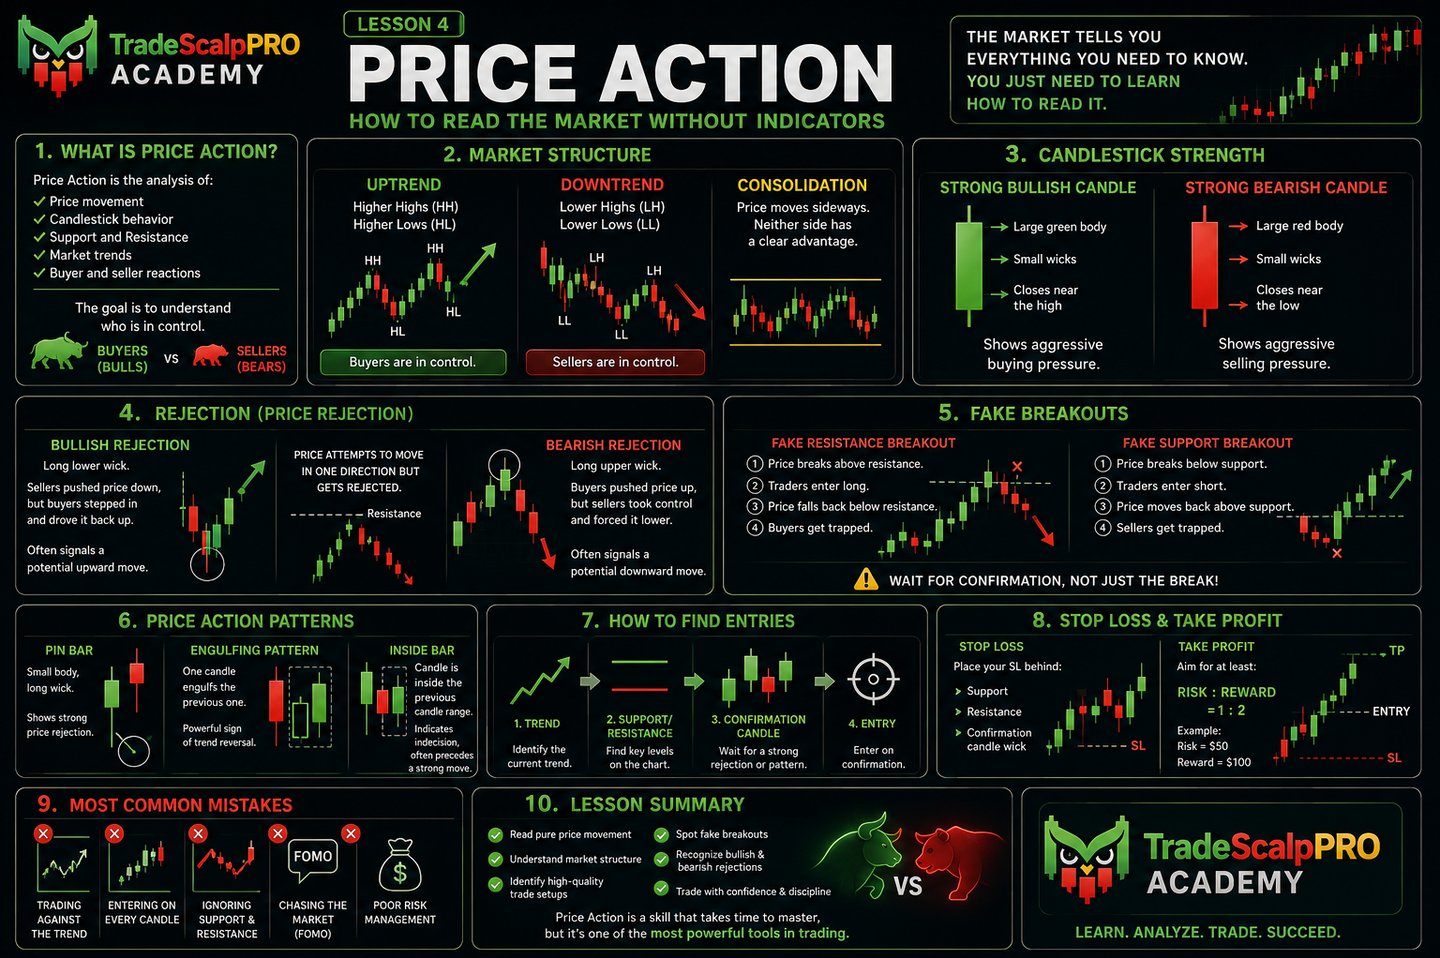
Price Action is the art of reading pure price movement. Instead of relying on dozens of indicators, traders focus on what the market itself is telling them through the chart.
1️⃣ What Is Price Action?
Price Action is the analysis of:
- Price movement
- Candlestick behavior
- Support and Resistance levels
- Market trends
- Buyer and seller reactions
The goal is to understand who is currently controlling the market.
📈 Buyers = Bulls
📉 Sellers = Bears
2️⃣ Market Structure
Every market creates a specific structure.
Uptrend
- Higher Highs (HH)
- Higher Lows (HL)
HH → HL → HH → HL
Buyers are in control.
Downtrend
- Lower Highs (LH)
- Lower Lows (LL)
LL → LH → LL → LH
Sellers are in control.
Consolidation
- Price moves sideways
- Neither side has a clear advantage
This is often a period of uncertainty before a breakout.
3️⃣ Candlestick Strength
The size and shape of a candle reveal a lot about market sentiment.
Strong Bullish Candle
✅ Large green body
✅ Small wicks
✅ Closes near the high
Shows aggressive buying pressure.
Strong Bearish Candle
✅ Large red body
✅ Small wicks
✅ Closes near the low
Shows aggressive selling pressure.
4️⃣ Rejection (Price Rejection)
One of the most important concepts in Price Action.
Price attempts to move in one direction but gets rejected.
Example:
Price breaks above resistance ↑
Then quickly falls back below ↓
This shows buyers lacked enough strength to continue higher.
Bullish Rejection
A long lower wick.
Sellers pushed price down, but buyers stepped in and drove it back up.
📈 Often signals a potential upward move.
Bearish Rejection
A long upper wick.
Buyers pushed price higher, but sellers took control and forced it lower.
📉 Often signals a potential downward move.
5️⃣ Fake Breakouts
One of the most common traps in trading.
Fake Resistance Breakout
1.Price breaks above resistance.
2.Traders enter long positions.
3.Price falls back below resistance.
4.Buyers become trapped.
Fake Support Breakout
1.Price breaks below support.
2.Traders enter short positions.
3.Price quickly moves back above support.
4.Sellers become trapped.
This is why professional traders wait for confirmation before entering a trade.
6️⃣ Price Action Patterns
Pin Bar
A small body with a long wick.
Indicates strong price rejection.
Engulfing Pattern
A candle completely covers the previous candle.
A powerful sign of potential trend reversal.
Inside Bar
A candle forms completely inside the range of the previous candle.
Represents market indecision and often precedes a strong move.
7️⃣ Finding Trade Entries
Professional traders look for:
✅ A clear trend
✅ Support or Resistance levels
✅ Candlestick confirmation
✅ Price Action patterns
Only then do they consider entering a trade.
8️⃣ Stop Loss and Take Profit
Stop Loss
Should be placed behind:
- Support levels
- Resistance levels
- Confirmation candle wicks
Take Profit
A good trade should aim for at least:
🎯 Risk-to-Reward Ratio = 1:2
Example:
- Risk = $50
- Potential Profit = $100
9️⃣ Most Common Trading Mistakes
❌ Trading against the trend
❌ Entering on every candle
❌ Ignoring Support and Resistance
❌ Chasing the market (FOMO)
❌ Poor Risk Management
🔥 Lesson Summary
After completing this lesson, you will be able to:
✅ Read pure price movement
✅ Understand market structure
✅ Identify high-quality trade setups
✅ Spot fake breakouts
✅ Recognize bullish and bearish rejections
✅ Trade with greater confidence and discipline
How to Protect Your Capital
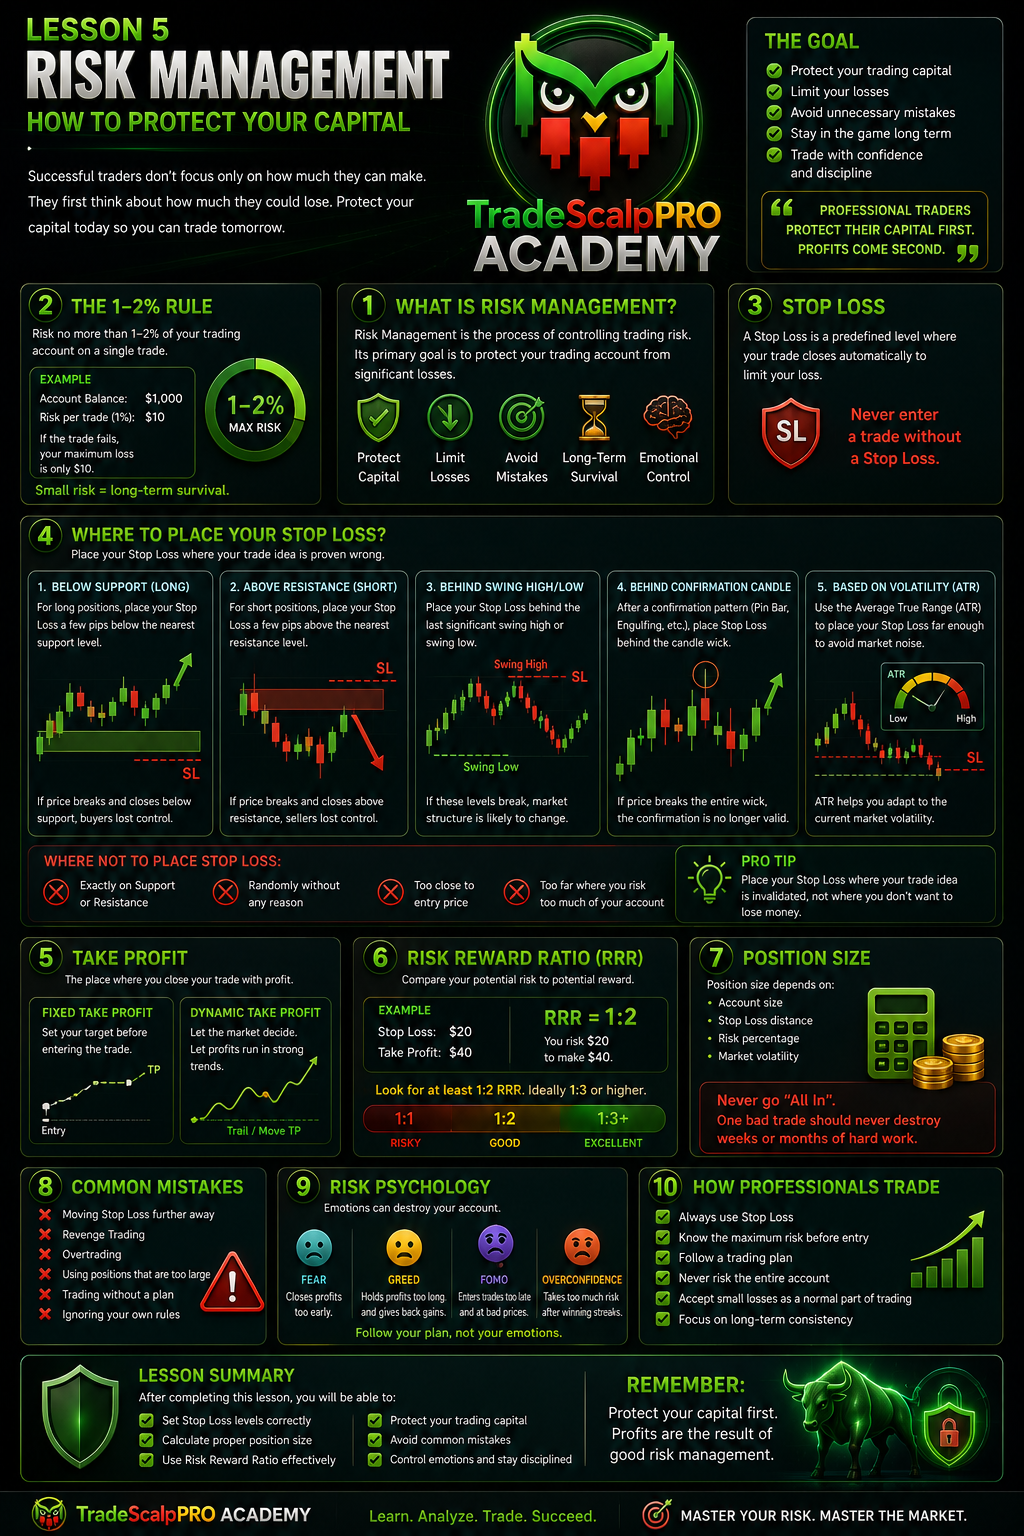
Risk Management is one of the most important skills every trader must develop. Many beginners spend hours searching for the perfect trade entry but forget the most important part of trading—protecting their capital.
Successful traders don't focus only on how much they can make. They first think about how much they could lose. If you can keep your losses small while allowing your profits to grow, you have a much greater chance of becoming consistently profitable over the long term.
1️⃣ What Is Risk Management?
Risk Management is the process of protecting your trading account from significant losses.
It helps you:
- Protect your trading capital
- Limit your losses
- Avoid unnecessary mistakes
- Stay profitable over the long term
- Remain calm during losing trades
Remember one important rule:
«Professional traders protect their capital first. Profits come second.»
2️⃣ The 1–2% Rule
One of the most common rules in trading is to risk no more than 1–2% of your trading capital on a single trade.
Example
Trading Account: $1,000
1% Risk = $10
If the trade fails, your maximum loss will be only $10.
If you risked 20% of your account on every trade, only a few losing trades could nearly wipe out your account.
Small risk leads to long-term survival.
3️⃣ Stop Loss
A Stop Loss is a predefined price level where your trade automatically closes to limit your losses.
It protects your account from unexpected market movements.
Never enter a trade without a Stop Loss.
4️⃣ Where Should You Place Your Stop Loss?
One of the biggest mistakes beginner traders make is placing their Stop Loss too close to the entry price. The market needs room to move naturally. If your Stop Loss is too tight, your trade may close before the market moves in your expected direction.
Professional traders place their Stop Loss where their trading idea becomes invalid.
✅ Below Support (LONG)
When opening a LONG position, the Stop Loss is usually placed a few points below the nearest support level.
If the price breaks below support and closes underneath it, buyers have likely lost control of the market.
---
✅ Above Resistance (SHORT)
For a SHORT position, the Stop Loss is typically placed a few points above the nearest resistance level.
If the price breaks above resistance, sellers are no longer in control.
---
✅ Behind the Latest Swing High or Swing Low
A Swing High represents the most recent significant market high.
A Swing Low represents the most recent significant market low.
If the market breaks these levels, the market structure often changes. This is why many professional traders place their Stop Loss behind these important price levels.
---
✅ Behind the Confirmation Candle Wick
If you enter a trade using Price Action (such as a Pin Bar or Bullish Engulfing pattern), your Stop Loss is often placed behind the wick of the confirmation candle.
If the market breaks the entire wick, the trade confirmation is no longer valid.
---
✅ Based on Volatility (ATR)
More experienced traders often use the Average True Range (ATR) indicator.
ATR measures the market's average price movement and helps place the Stop Loss far enough away to avoid being stopped out by normal market fluctuations.
---
❌ Where Should You NOT Place Your Stop Loss?
Never place your Stop Loss:
❌ Exactly on a Support or Resistance level.
❌ Randomly based on emotion.
❌ Too close to your entry price.
❌ So far away that you risk too much of your trading account.
5️⃣ Take Profit
A Take Profit is the price level where your trade automatically closes with a profit.
There are two common approaches.
Fixed Take Profit
Your profit target is set before entering the trade.
Example:
- Entry: $100
- Take Profit: $105
Dynamic Take Profit
Your exit is adjusted based on current market conditions.
If the trend continues, you allow your profits to grow.
6️⃣ Risk-to-Reward Ratio (RRR)
The Risk-to-Reward Ratio compares your potential risk to your expected reward.
Example
Stop Loss = $20
Take Profit = $40
RRR = 1:2
This means you are risking $20 to potentially earn $40.
Professional traders generally look for trades with a minimum Risk-to-Reward Ratio of 1:2, ideally 1:3 or higher.
7️⃣ Position Size
Position size determines how much of an asset you buy or sell.
It depends on:
- Your trading account size
- The distance to your Stop Loss
- Your risk percentage
- Current market volatility
Never trade "All In."
One bad trade should never destroy weeks or months of hard work.
8️⃣ Most Common Trading Mistakes
❌ Moving your Stop Loss further into loss.
❌ Revenge Trading – trying to recover losses immediately.
❌ Overtrading – taking too many trades.
❌ Using position sizes that are too large.
❌ Trading without a trading plan.
❌ Ignoring your own trading rules.
9️⃣ Risk Psychology
Risk Management is not only about numbers.
It is also about controlling your emotions.
Fear
Closing profitable trades too early.
Greed
Holding winning trades for too long, hoping for even bigger profits.
FOMO (Fear of Missing Out)
Entering the market too late because you don't want to miss the move.
Overconfidence
Risking too much after a series of winning trades.
Professional traders make decisions based on their trading plan—not their emotions.
🔟 How Do Professional Traders Manage Risk?
Professional traders:
✅ Always use a Stop Loss.
✅ Know their maximum risk before entering a trade.
✅ Follow a trading plan.
✅ Never risk their entire trading account.
✅ Accept small losses as a normal part of trading.
✅ Focus on long-term consistency.
---
📋 Lesson Summary
After completing this lesson, you will be able to:
✅ Set your Stop Loss correctly.
✅ Determine the appropriate position size.
✅ Use the Risk-to-Reward Ratio effectively.
✅ Protect your trading capital.
✅ Avoid the most common trading mistakes.
✅ Control your emotions while trading.
✅ Trade with discipline and professionalism.
🦉 Conclusion
Success in trading is not determined by how many trades you win.
True success comes from how well you manage your losses. A trader who protects their capital will always have another opportunity to trade tomorrow.
Remember: Protect your capital first. Profits are the result of proper risk management.
Trading Psychology
Introduction
Many beginner traders believe that success depends on finding the perfect trading strategy. In reality, most losing trades are not caused by a bad strategy, but by emotions. Fear, greed, impatience, and frustration can ruin even the best trading plan.
Trading psychology is the ability to control your emotions and make rational decisions based on predefined rules. Successful traders do not trade based on feelings—they trade according to their plan.
Why Is Trading Psychology So Important?
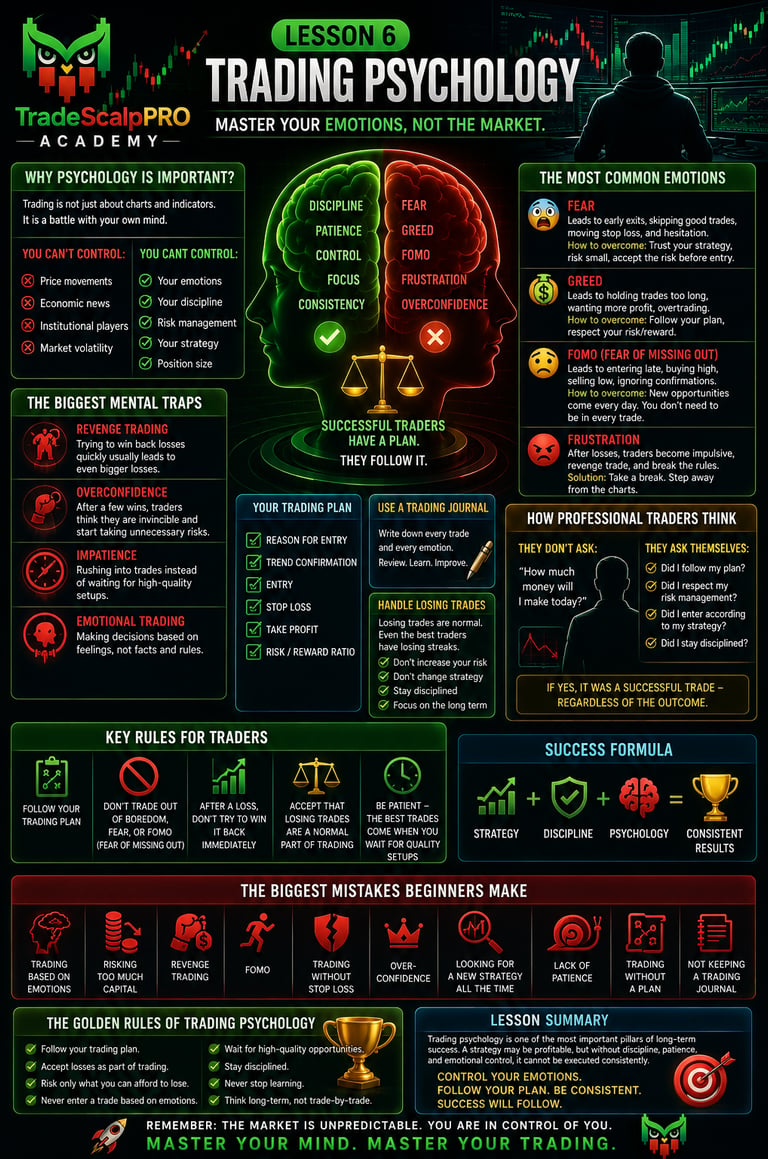
Trading is not just about charts and indicators. It is primarily a battle with your own mind.
You cannot control:
- Price movements
- Economic news
- Large institutional traders
- Market volatility
But you can control:
- Your emotions
- Your discipline
- Your risk management
- Your commitment to your strategy
- Your position size
This is exactly what separates successful traders from the majority.
The Most Common Emotions in Trading
😨 Fear
Fear is the most common emotion among beginner traders.
It often leads to:
- Closing profitable trades too early
- Being afraid to enter a new trade after a loss
- Moving the Stop Loss
- Skipping high-quality trading opportunities
How to Overcome Fear
- Trust your trading strategy.
- Risk only a small portion of your capital.
- Accept the possibility of a loss before entering a trade.
💰 Greed
Greed makes traders want more profit than their trading plan allows.
Common consequences:
- Ignoring the Take Profit target
- Holding trades for too long
- Opening positions that are too large
- Trading too frequently
How to Control Greed
Always follow your predefined Risk-to-Reward ratio and trading plan.
⚡ FOMO (Fear of Missing Out)
FOMO is the fear of missing a trading opportunity.
A trader affected by FOMO may:
- Enter too late
- Buy at the top
- Sell at the bottom
- Ignore confirmation signals
How to Avoid FOMO
Remember:
The market will always provide new opportunities.
You do not need to be in every trade.
😡 Frustration
After several losing trades, traders often become emotional and impulsive.
Typical signs include:
Revenge trading
Overtrading
Breaking trading rules
Solution
Take a break after a series of losses.
Revenge Trading
One of the biggest mistakes in trading.
After a losing trade, a trader may:
- Increase position size
- Open another trade without proper analysis
- Try to recover losses immediately
The result?
Usually even bigger losses.
Successful traders never trade based on emotions.
Overconfidence
After several winning trades, some traders begin to believe they have mastered the market.
As a result, they may:
- Stop using Stop Losses
- Increase their risk
- Ignore their trading rules
This often ends with a significant loss.
Discipline
Discipline means doing the right thing even when you don't feel like it.
Professional traders:
- Wait for high-quality setups
- Follow their trading plan
- Never trade out of boredom
- Never ignore their rules
Discipline is more important than talent.
Patience
The best traders do not trade all the time.
Instead, they wait for the highest-quality opportunities.
Sometimes they take only one excellent trade in an entire day.
Remember:
It's not the number of trades that makes you profitable—it's the quality of those trades.
Your Trading Plan
Every trade should include:
- A clear reason for entering
- Trend confirmation
- Entry price
- Stop Loss
- Take Profit
- Risk-to-Reward ratio
If any of these elements are missing...
The trade is probably not worth taking.
Trading Journal
Every professional trader keeps a trading journal.
After each trade, record:
- Why you entered
- Why you exited
- What emotions you experienced
- What you did well
- What you can improve next time
A trading journal is one of the fastest ways to improve.
How to Handle Losing Trades
Losing trades are completely normal.
Even the best traders experience losing streaks.
The difference is that professionals:
- Do not increase their risk
- Do not change strategies after one loss
- Remain disciplined
One trade does not determine your long-term success.
How Professional Traders Think
Professional traders do not ask:
- "How much money will I make today?"
Instead, they ask themselves:
- Did I follow my trading plan?
- Did I respect my risk management rules?
- Did I enter according to my strategy?
- Did I stay disciplined?
If the answer is yes, then it was a successful trade—regardless of the outcome.
The Biggest Mistakes Beginners Make
❌ Trading based on emotions
❌ Risking too much capital
❌ Revenge trading
❌ FOMO
❌ Trading without a Stop Loss
❌ Overconfidence
❌ Constantly searching for a new strategy
❌ Lack of patience
❌ Trading without a plan
❌ Not keeping a trading journal
Golden Rules of Trading Psychology
🟢 Follow your trading plan.
🟢 Accept losses as part of trading.
🟢 Risk only what you can afford to lose.
🟢 Never enter a trade based on emotions.
🟢 Wait for high-quality trading opportunities.
🟢 Stay disciplined.
🟢 Never stop learning.
🟢 Think long-term, not trade-by-trade.
Lesson Summary
Trading psychology is one of the most important pillars of long-term success. A trading strategy may be profitable, but without discipline, patience, and emotional control, it cannot be executed consistently.
Learn to control your emotions, follow your trading plan, and accept losses as a natural part of trading. In the long run, success does not belong to the trader who takes the most trades—it belongs to the trader who consistently makes the right decisions.
📚 Lesson 7 – Trading Plan
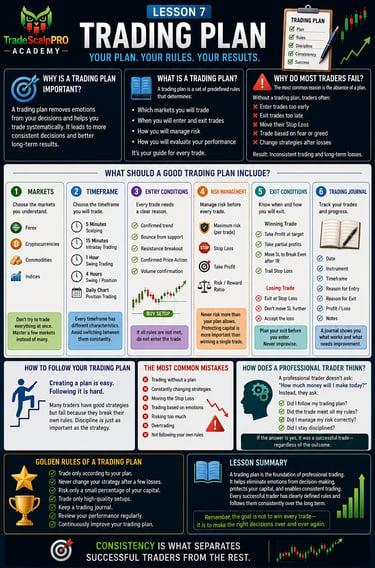
Why Is a Trading Plan Important?
Many beginner traders enter trades based purely on feelings or emotions. They see the price rising rapidly and immediately buy. As soon as the market starts falling, they panic and sell at a loss. This is not a trading strategy—it's gambling.
Successful traders approach the market differently. Every trade is planned before they enter. They know exactly when to enter, when to exit, how much they are willing to risk, and under what conditions they will avoid taking a trade altogether.
This set of predefined rules is called a Trading Plan.
A trading plan helps remove emotions from the decision-making process and allows you to trade systematically. As a result, you make more consistent decisions and can evaluate your performance over the long term.
What Is a Trading Plan?
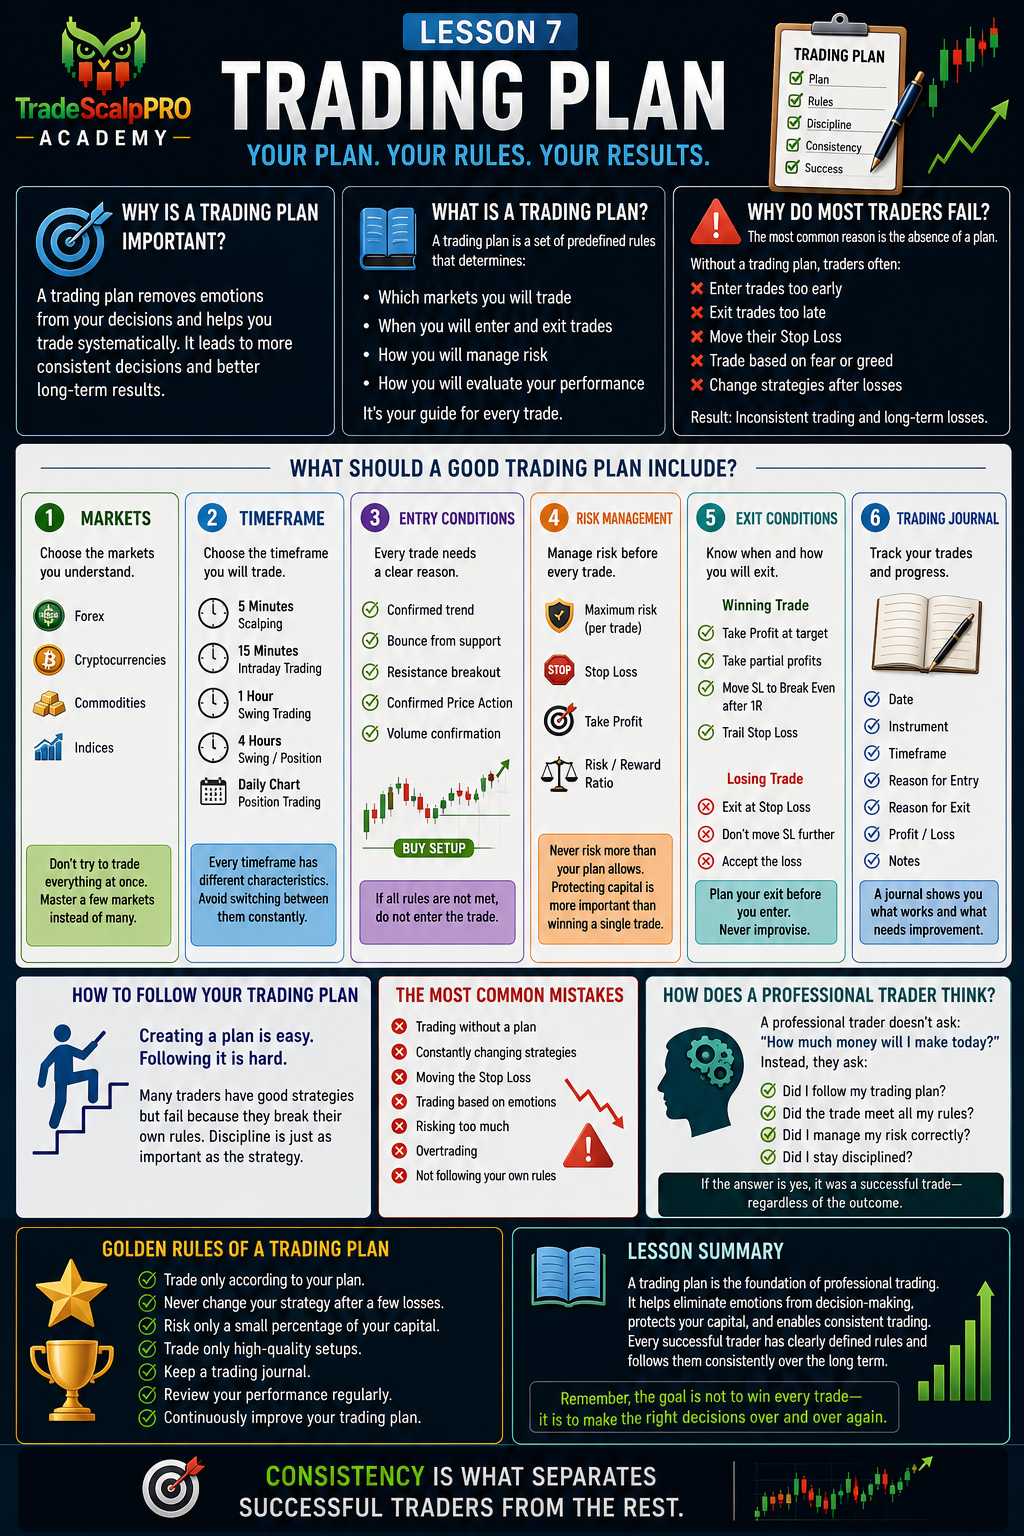
A trading plan is a set of predefined rules that determines:
Which markets you will trade
When you will enter trades
When you will exit trades
How you will manage risk
How you will evaluate your performance
A trading plan is your guide for every trade. When you follow it, your decisions are based on rules—not emotions.
Why Do Most Traders Fail?
The most common reason is not a bad strategy.
It is the absence of a plan.
Without a trading plan, traders often:
Enter trades too early
Exit trades too late
Move their Stop Loss
Open trades out of fear or greed
Change strategies after a few losing trades
The result is inconsistent trading and long-term losses.
What Should a Good Trading Plan Include?
1️⃣ Markets
First, choose the markets you understand.
For example:
Forex
Cryptocurrencies
Commodities
Indices
Don't try to trade everything at once.
It is far better to master a few markets than to follow dozens of instruments superficially.
2️⃣ Timeframe
Choose the timeframe you will trade.
For example:
5 Minutes – Scalping
15 Minutes – Intraday Trading
1 Hour – Swing Trading
4 Hours
Daily Chart
Every timeframe has different characteristics.
The important thing is to avoid constantly switching between them.
3️⃣ Entry Conditions
Every trade must have a clear reason.
For example:
✅ Confirmed trend
✅ Bounce from support
✅ Resistance breakout
✅ Confirmed Price Action
✅ Volume confirmation
If all your trading rules are not met, do not enter the trade.
4️⃣ Risk Management
Risk Management is an essential part of every trading plan.
Before every trade, determine:
Maximum risk
Stop Loss
Take Profit
Risk-to-Reward Ratio
Never risk more than your trading plan allows.
Remember:
Protecting your capital is more important than winning a single trade.
5️⃣ Exit Conditions
Before entering a trade, you must know:
When you will close a profitable trade
When you will accept a loss
Whether you will move your Stop Loss
Whether you will take partial profits
Never improvise while a trade is open.
6️⃣ Trading Journal
Every professional trader keeps a trading journal.
After every trade, record:
Date
Instrument
Timeframe
Reason for Entry
Reason for Exit
Profit or Loss
Personal Notes
A trading journal helps you identify what works and what needs improvement.
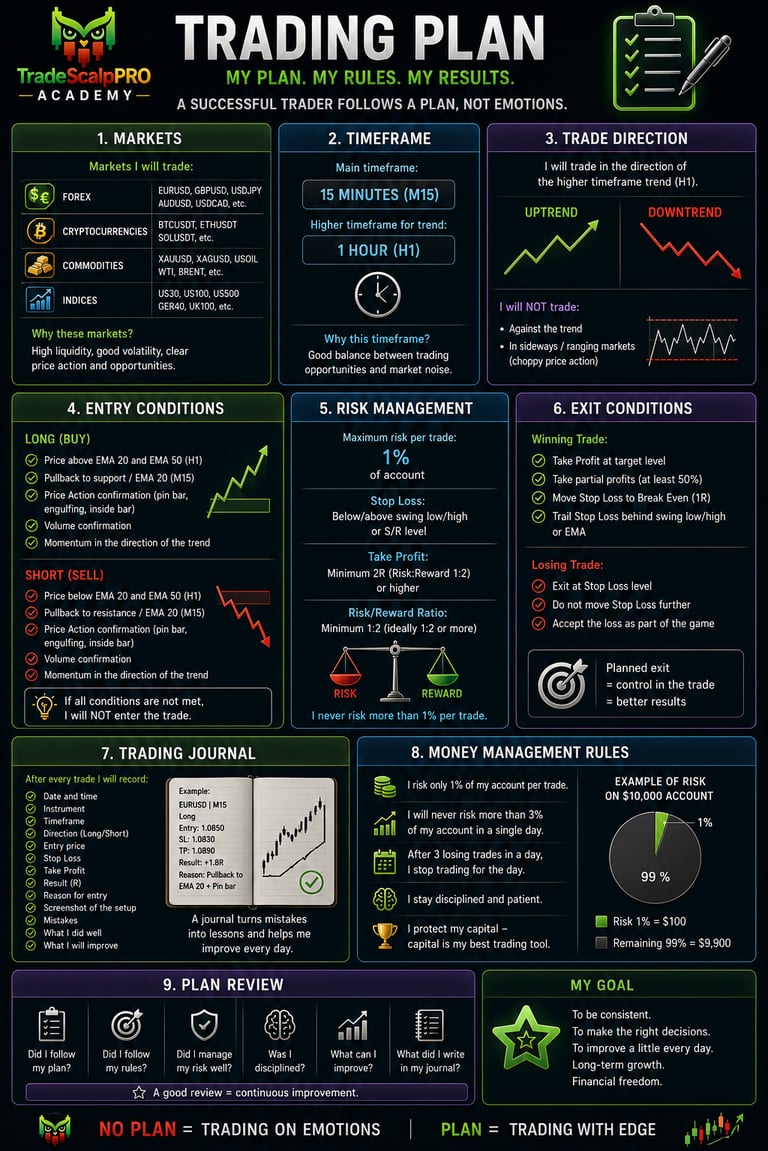
How to Follow Your Trading Plan
Creating a trading plan is not the hardest part.
Following it is.
Many traders have a good strategy but fail because they break their own rules.
Discipline is just as important as the strategy itself.
The Most Common Mistakes
❌ Trading without a plan
❌ Constantly changing strategies
❌ Moving the Stop Loss
❌ Trading based on emotions
❌ Risking too much
❌ Overtrading
❌ Not following your own rules
How Does a Professional Trader Think?
A professional trader doesn't ask:
"How much money will I make today?"
Instead, they ask:
Did I follow my trading plan?
Did the trade meet all my rules?
Did I manage my risk correctly?
Did I stay disciplined?
If the answer is yes, then it was a successful trade—regardless of the outcome.
Golden Rules of a Trading Plan
🟢 Trade only according to your plan.
🟢 Never change your strategy after a few losses.
🟢 Risk only a small percentage of your capital.
🟢 Trade only high-quality setups.
🟢 Keep a trading journal.
🟢 Review your performance regularly.
🟢 Continuously improve your trading plan.
Lesson Summary
A trading plan is the foundation of professional trading. It helps eliminate emotions from decision-making, protects your capital, and enables consistent trading. Every successful trader has clearly defined rules and follows them consistently over the long term.
Remember, the goal is not to win every trade—it is to make the right decisions over and over again. Consistency is what separates successful traders from the rest.

📚 Lesson 8 – Position Sizing
How to Calculate the Right Trade Size
Why Is Position Sizing So Important?
Many traders spend hours searching for the perfect trade entry but completely ignore one of the most important aspects of trading—how large their position should be.
Even an excellent trading strategy can fail if the position size is too large. On the other hand, a solid risk management plan with proper position sizing can keep a trader profitable over the long term, even if not every trade is successful.
Professional traders understand that protecting capital is always the first priority. Profit comes only after risk is under control.


What Is Position Sizing?
Position sizing determines how much of an asset you buy or sell in a single trade.
Depending on the market, this may be measured in:
- Lots (Forex)
- Contracts (Futures)
- Shares (Stocks)
- Coins or Tokens (Crypto)
The correct position size should never be based on:
❌ Emotions
❌ Confidence
❌ Hope
❌ Greed
Instead, it should always be calculated using objective data.
Four Things You Must Know Before Every Trade
Before opening any position, you need to know:
1. Account Balance
Your current trading account value.
Example:
Account Balance = $10,000
2. Risk Percentage
Decide how much of your account you're willing to lose if the trade fails.
Professional traders usually risk:
- Conservative: 0.5%
- Standard: 1%
- Aggressive: 2%
Higher risk means larger drawdowns.
3. Entry Price
The price where your trade will be opened.
Example:
Buy EUR/USD at 1.1200
4. Stop Loss
The level where the trade will automatically close if the market moves against you.
Example:
Stop Loss = 1.1150
Distance = 50 pips
Why Do Professional Traders Risk Only 1–2%?
Imagine your account is worth $10,000.
Risking 1%
Maximum loss:
$100
Even after several losing trades, your account remains healthy.
Risking 10%
Maximum loss:
$1,000
Just a few bad trades could severely damage your trading account.
Small losses are easy to recover.
Large losses require much bigger gains.
Example
Starting balance:
$10,000
Lose 10%
New balance:
$9,000
To return to $10,000, you need:
11.1% profit
Lose 50%
Balance:
$5,000
To recover:
100% profit
The bigger the loss, the harder the recovery.
Position Size Formula
The basic formula is:
Position Size = Account Risk ÷ Stop Loss Value
Where:
Account Risk = Account Balance × Risk %
Practical Example
Account:
$10,000
Risk:
1%
Maximum Risk:
$100
Stop Loss:
50 pips
Value per pip:
$10
Calculation:
Position Size = $100 ÷ (50 × $10)
Position Size = 0.20 lots
This means that if the Stop Loss is hit, you lose exactly $100.
What Affects Position Size?
Several factors influence the correct trade size:
Account Size
Larger accounts allow larger positions while maintaining the same percentage risk.
Stop Loss Distance
A wider Stop Loss means a smaller position.
A tighter Stop Loss allows a larger position.
Never move your Stop Loss just to increase position size.
Market Volatility
Highly volatile markets often require wider Stop Losses.
This naturally reduces your position size.
Instrument Type
- Forex
- Stocks
- Crypto
- Indices
- Commodities
Each market has different contract sizes and price movements.
Why You Should Never Increase Position Size After a Loss
One of the biggest psychological mistakes is trying to "win the money back."
Example:
Trade 1:
Lose $100
Trade 2:
Double the position size
Lose $200
Trade 3:
Increase again
Lose $400
Within a few trades, the account suffers serious damage.
This is called revenge trading and is one of the fastest ways to destroy a trading account.
Common Position Sizing Mistakes
❌ Opening positions that are too large
❌ Trading without calculating risk
❌ Ignoring Stop Loss
❌ Moving Stop Loss further away
❌ Increasing position size after losses
❌ Risking more than 2% per trade
❌ Believing every trade will be a winner
Golden Rules
✅ Decide your risk before entering the trade.
✅ Set your Stop Loss first.
✅ Calculate position size afterward.
✅ Keep risk consistent.
✅ Accept losses as part of trading.
✅ Never trade emotionally.
✅ Protect your capital above everything else.
Lesson Summary
Position sizing is one of the foundations of professional trading. It ensures that every trade carries a controlled and predefined level of risk, regardless of market conditions.
The goal is not to maximize profits on a single trade, but to protect your capital so you can continue trading over the long term.
Consistent traders understand that success comes from disciplined risk management—not from taking oversized positions.
Remember: The trader who survives the longest is usually the trader who manages risk the best.

📚 Lesson 9 – Mastering the Chart: Complete Guide
The goal of this lesson is to teach users not only how to “look at” a chart, but how to truly understand it. A chart shows what buyers and sellers are doing, how the strength of price movement changes, where the market reacts, and where potential trading opportunities may develop.


1. Types of Charts
The candlestick chart is the most commonly used because each candle shows the Open, High, Low, and Close. It is suitable for Price Action, trend analysis, and precise trade entries.
A line chart usually connects closing prices. It is simpler and cleaner, but it does not show the details inside each period.
A bar chart also displays OHLC data, but in a different visual format than candlesticks.
Heikin Ashi smooths price movement. It makes trends easier to follow, but the candles do not represent exact market OHLC prices, so it is less suitable for precise entries.
2. How to Read Candles – OHLC
Each standard candle contains four basic values:
Open – the price at the beginning of the period.
High – the highest price reached.
Low – the lowest price reached.
Close – the price at the end of the period.
A green candle usually means that the Close is above the Open. A red candle means that the Close is below the Open.
A large candle body often shows stronger pressure from one side of the market. A small body may indicate indecision. A long upper wick can suggest rejection of higher prices, while a long lower wick can suggest rejection of lower prices.
However, one candle alone is usually not enough. What matters is where it forms and in what market context.
3. Timeframes
A timeframe determines how much time one candle represents.
For example:
1M = 1 minute
5M = 5 minutes
15M = 15 minutes
30M = 30 minutes
1H = 1 hour
4H = 4 hours
1D = 1 day
1W = 1 week
Lower timeframes provide more detail, but also more market noise. Higher timeframes make it easier to identify the main trend and important market structures.
Working with multiple timeframes is very important. For example, you can identify the main trend on the 4H chart, analyze structure on the 1H chart, and look for a more precise entry on the 15M chart.
4. Trend
The market can move in three main ways.
An uptrend creates higher highs and higher lows.
A downtrend creates lower highs and lower lows.
A sideways trend, or consolidation, means that price moves within a defined range without a clear direction.
The first question you should ask when opening a chart is:
Is the market trending up, trending down, or consolidating?
5. Market Structure
Market structure helps describe the trend more precisely.
HH – Higher High = a higher maximum.
HL – Higher Low = a higher minimum.
LH – Lower High = a lower maximum.
LL – Lower Low = a lower minimum.
In an uptrend, you typically see a sequence of HH and HL.
In a downtrend, you typically see LH and LL.
If this structure begins to break, the trend may be changing.
CHoCH – Change of Character refers to an early significant change in market structure. It is not automatically a trade signal, but it can warn you that market behavior may be shifting.
6. Trend Lines
A trend line helps visually represent the direction of the market.
In an uptrend, you connect significant lows.
In a downtrend, you connect significant highs.
Two points create the line, but a third and additional touches increase its significance.
A trend line should not be forced to fit the price. If you constantly have to move it, it is probably not drawn correctly.
A trend line is not a perfectly precise barrier. It is better understood as an area where price may react.
7. Trend Channels
A trend channel is formed by two approximately parallel lines.
In an ascending channel, the lower boundary acts as dynamic support and the upper boundary as dynamic resistance.
In a descending channel, the opposite applies.
A sideways channel forms when price moves between horizontal support and resistance.
Channels help you see whether price is approaching the lower or upper boundary and whether a potential breakout may be developing.
However, a simple touch of the channel boundary is not enough reason to enter a trade.
8. Support and Resistance
Support is an area where price declines repeatedly stop and buyers begin to appear.
Resistance is an area where price rises repeatedly stop and sellers begin to appear.
The more meaningful reactions an area has, the more important it may become.
Support and Resistance are often better drawn as zones, rather than as one perfectly precise line.
After a breakout, their roles can reverse. Previous resistance may become support, and previous support may become resistance.
9. Breakout
A breakout means that price moves through an important level.
A higher-quality breakout usually includes several confirmations:
a strong candle, a close beyond the level, increased volume, or a later retest.
A retest means that price returns to the broken level and tests it from the opposite side.
A False Breakout occurs when price briefly moves beyond the level but then returns back into the previous range.
For this reason, it is not advisable to enter automatically every time price touches or breaks a line.
10. Price Action
Price Action means observing the behavior of price itself.
A trader watches:
candle size, wicks, reactions at important levels, speed of movement, market structure, and behavior after a breakout.
For example, a large green candle may indicate strong buying pressure. A long upper wick at resistance may indicate rejection of higher prices.
The meaning always depends on the context.
11. Volume
Volume shows trading activity.
Increasing volume during a breakout can make the breakout more credible.
A strong price movement with very low volume may be less convincing.
A Volume Spike is a sudden significant increase in volume. It can indicate strong market activity, but by itself it does not tell you whether to buy or sell.
12. EMA – Moving Averages
EMAs help track trend direction and price dynamics.
For example:
EMA20 reacts more quickly and reflects shorter-term movement.
EMA50 is slower and can help identify the medium-term trend.
EMA200 is often used to assess the longer-term market direction.
Price above the EMA can support a bullish view, while price below the EMA can support a bearish view. However, an EMA is not a standalone trading signal.
13. Volatility – ATR
ATR measures the size of price movement, not its direction.
Higher ATR means greater volatility.
Lower ATR means a calmer market.
ATR can be useful when setting a Stop Loss because the Stop Loss should take the market’s normal movement into account.
A Stop Loss that is too tight in a highly volatile market may be triggered simply by normal price noise.


14. Consolidation
Consolidation occurs when price has no clear trend and moves between defined boundaries.
During this phase, buyers and sellers often alternate without a clear winner.
A trader should monitor the upper and lower boundaries of the range and wait to see whether the market produces a genuine breakout.
A long consolidation can precede a larger move, but the direction cannot be known in advance.
15. Trade Entries
The image shows three typical situations.
Pullback – price temporarily moves back toward an important level during a trend and then continues in the original direction.
Breakout – price breaks through an important boundary.
Retest – after the breakout, price returns to the broken level and reacts again.
A high-quality entry should have confirmation, such as market structure, Price Action, volume, or alignment with the trend on a higher timeframe.
16. Trade Exits
Take Profit is a predefined level where profit is realized.
Stop Loss protects capital when the trade scenario becomes invalid.
Trailing Stop allows the protective level to move gradually in the direction of a profitable trade.
SL and TP should not be set randomly. They should be based on market structure, volatility, and the trading plan.
17. Most Common Mistakes
One of the most common mistakes is overdrawing the chart. Too many lines and indicators can make it difficult to see the price itself.
Another mistake is watching only one timeframe.
It is also risky to trade against a clear trend without a strong reason, enter without confirmation, or use excessive risk.
The chart should help with decision-making, not give the trader an excuse to enter a trade at any cost.
18. Golden Rules
First, determine the current market condition.
Then mark the main support and resistance areas.
Identify the structure and trend.
Only then look for a trading opportunity.
Wait for confirmation.
Before entering, you should know your Entry, Stop Loss, Take Profit, and risk.
If the trade does not make sense, the best decision may be not to enter.
19. Practical Examples
On a real chart, a trader should follow a similar process every time:
Identify the higher timeframe and determine the main direction.
Find the market structure: HH/HL or LH/LL.
Mark Support and Resistance.
Draw a trend line or channel if relevant.
Watch how price behaves near a key area.
Wait for Price Action or another form of confirmation.
Define Entry, SL, and TP.
Check the Risk/Reward ratio.
Only then decide whether to enter the trade.
This transforms the chart from an image full of candles into a systematic decision-making tool.
20. Lesson Summary
A chart is a visual record of the battle between buyers and sellers.
Candles show individual price movements. Market structure shows direction. Support and Resistance highlight important areas. Trend lines and channels help visualize market dynamics. Volume, EMA, and ATR add additional information.
However, the most important thing is not to use as many tools as possible.
The goal is to understand what the market is doing and why.
A good chart analysis can follow a simple process:
Trend → Structure → Key Levels → Price Action → Confirmation → Trading Plan → Risk Management
This is the foundation on which more advanced trading strategies can be built.