


Welcome to TradeScalpPRO Academy
If you are a complete beginner, you are in the right place. In these lessons, you will learn the basic concepts that every trader should know before they start trading.
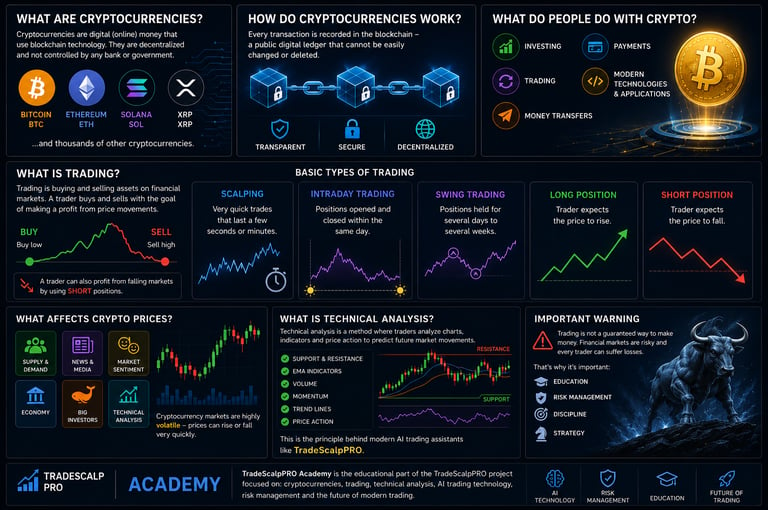
What Are Cryptocurrencies?
Cryptocurrencies are digital (online) money that operate using a technology called blockchain.
They are not controlled by a single bank or government but work in a decentralized way through a network of computers around the world.
The most well-known cryptocurrency is Bitcoin, but there are thousands of others, such as Ethereum, Solana, and XRP.
How Do Cryptocurrencies Work?
Every transaction is recorded on a blockchain — a public digital database that cannot be easily modified or deleted. This makes cryptocurrencies transparent and secure.
People use cryptocurrencies for:
Investing
Trading
Money transfers
Payments
Modern technologies and applications
What Is Trading?
Trading is the process of buying and selling financial assets, such as cryptocurrencies, stocks, commodities, or currencies, with the goal of making a profit from price movements.
Traders analyze the market, look for opportunities, and decide when to enter or exit a trade.
There are different types of trading, including:
Scalping (very short-term trades)
Day Trading (opening and closing trades within the same day)
Swing Trading (holding trades for several days or weeks)
Long-Term Investing
For beginners, it is important to first learn the basics of market analysis, risk management, and trading psychology before risking real money.
What Influences Cryptocurrency Prices?
Cryptocurrency prices constantly change based on:
Supply and demand
News and media coverage
Market sentiment
Economic conditions
Large investors (whales)
Technical analysis
This is why cryptocurrencies are highly volatile — their prices can rise or fall very quickly.
What Is Technical Analysis?
Technical analysis is a method in which traders analyze charts, indicators, and price movements to predict the future direction of the market.
Common tools include:
Support and resistance levels
EMA indicators
Volume
Momentum
Trend lines
Price action
Modern AI trading assistants such as TradeScalpPRO are built on these principles.
Important Notice
Trading is not a guaranteed way to make money. Financial markets are risky, and every trader can experience losses.
That is why the following are important:
Education
Risk Management
Discipline
A Proper Trading Strategy
TradeScalpPRO Academy
TradeScalpPRO Academy is the educational part of the TradeScalpPRO project, focused on:
Cryptocurrencies
Trading
Technical Analysis
AI Trading Technologies
Risk Management
The Future of Modern Trading
The goal of the academy is to help beginners understand financial markets and build a solid foundation before they start trading with real money.
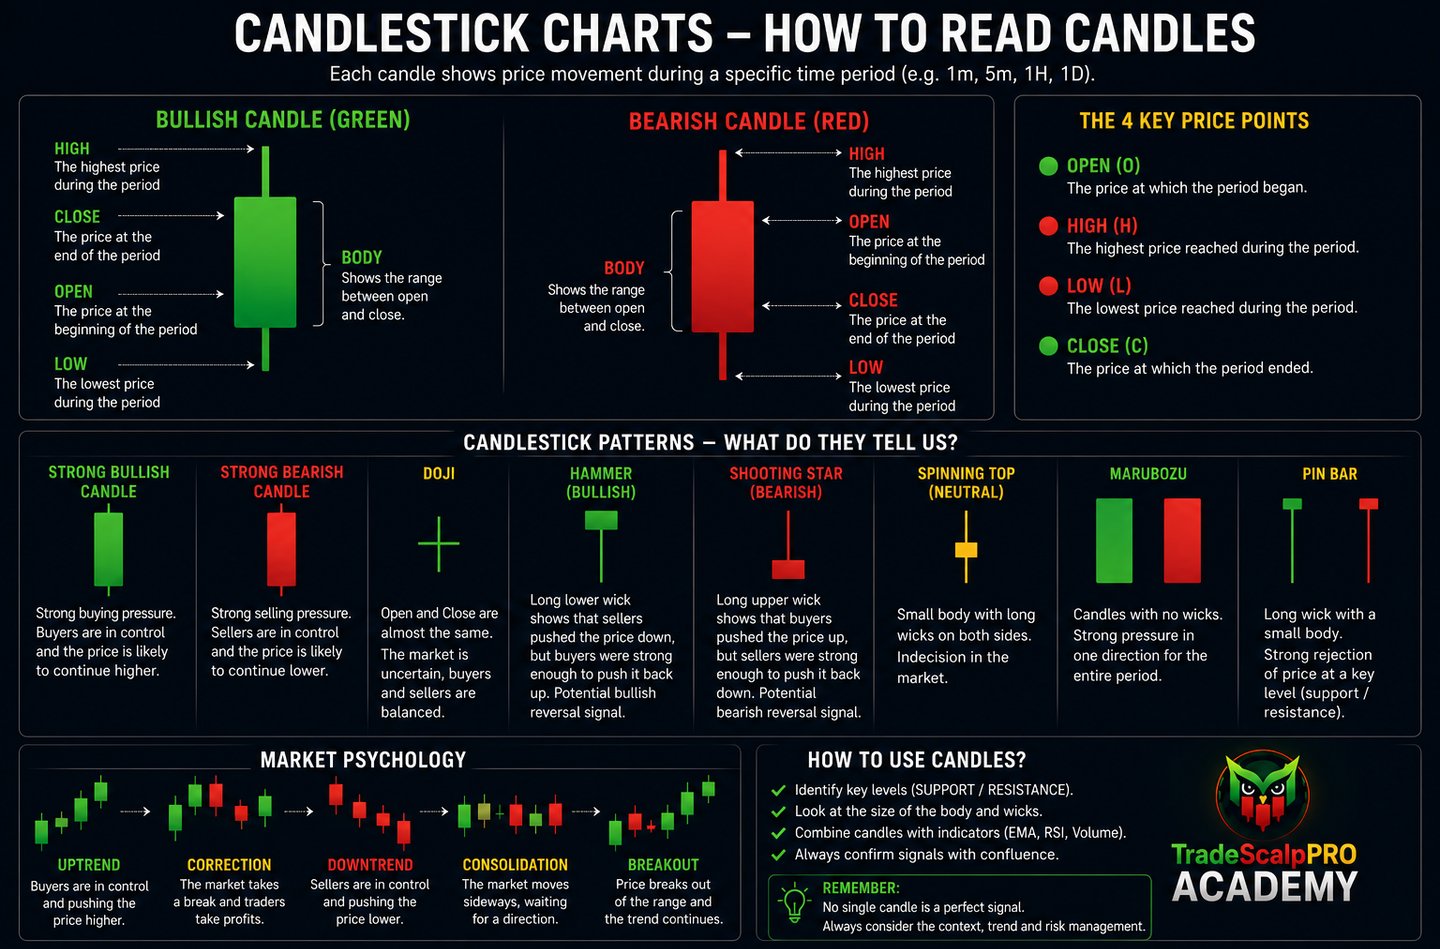
How to Read Candlestick Charts
What Is a Candlestick Chart?
A candlestick chart is the most commonly used chart type in trading. Each candlestick shows how the price moved during a specific period of time.
Examples:
- 1-minute chart = one candlestick represents 1 minute
- 5-minute chart = one candlestick represents 5 minutes
- 1-hour chart = one candlestick represents 1 hour
What Does a Candlestick Consist Of?
Each candlestick contains 4 important values:
Open
The price at the beginning of the period.
High
The highest price reached during the period.
Low
The lowest price reached during the period.
Close
The price at the end of the period.
💡 Tip for beginners:
The relationship between the Open and Close prices determines whether the candle is bullish (price increased) or bearish (price decreased).
Green Candle 🟢
A green candle means that the price increased during the selected period.
Close is higher than Open.
Example:
Open: 100 USDC
Close: 105 USDC
Buyers were in control.
Red Candle 🔴
A red candle means that the price decreased during the selected period.
Close is lower than Open.
Example:
Open: 105 USDC
Close: 100 USDC
Sellers were in control.
Candle Body
The body is the main part of a candlestick.
Large Body
Strong buying pressure
Strong selling pressure
Small Body
Market indecision
A battle between buyers and sellers
Candle Wicks
Wicks show how far the price moved during the selected period.
Upper Wick
The price moved higher but was pushed back down by sellers.
Lower Wick
The price moved lower but was pushed back up by buyers.
Long wicks often signal price rejection.
Large Green Candle
🟢 Buyers are in control.
Often confirms an uptrend.
Large Red Candle
🔴 Sellers are in control.
Often confirms a downtrend.
Doji
The Open and Close prices are almost the same.
It signals market indecision.
Neither buyers nor sellers have gained control.
Hammer
A small body at the top of the candle.
A long lower wick.
Often signals a potential bullish reversal (price may move higher).
Shooting Star
A small body at the bottom of the candle.
A long upper wick.
Often signals a potential bearish reversal (price may move lower).
How Does TradeScalpPRO Use Candlesticks?
TradeScalpPRO analyzes:
✅ Candle strength
✅ Body size
✅ Wick size
✅ Market momentum
✅ EMA trend
✅ Volume
Thanks to this analysis, it can identify:
🟢 LONG
🔴 SHORT
🟡 WAIT (no clear trading opportunity)
Practical Exercise
Open a Bitcoin chart.
Find:
The largest green candle from the last 24 hours.
The largest red candle from the last 24 hours.
A candle with a long lower wick.
A candle with a long upper wick.
A place where several green candles formed in a row.
Try to Answer:
Who was in control?
Buyers or sellers?